Yaqui vs Panamanian Unemployment Among Ages 45 to 54 years
COMPARE
Yaqui
Panamanian
Unemployment Among Ages 45 to 54 years
Unemployment Among Ages 45 to 54 years Comparison
Yaqui
Panamanians
4.7%
UNEMPLOYMENT AMONG AGES 45 TO 54 YEARS
1.4/ 100
METRIC RATING
238th/ 347
METRIC RANK
4.6%
UNEMPLOYMENT AMONG AGES 45 TO 54 YEARS
10.7/ 100
METRIC RATING
213th/ 347
METRIC RANK
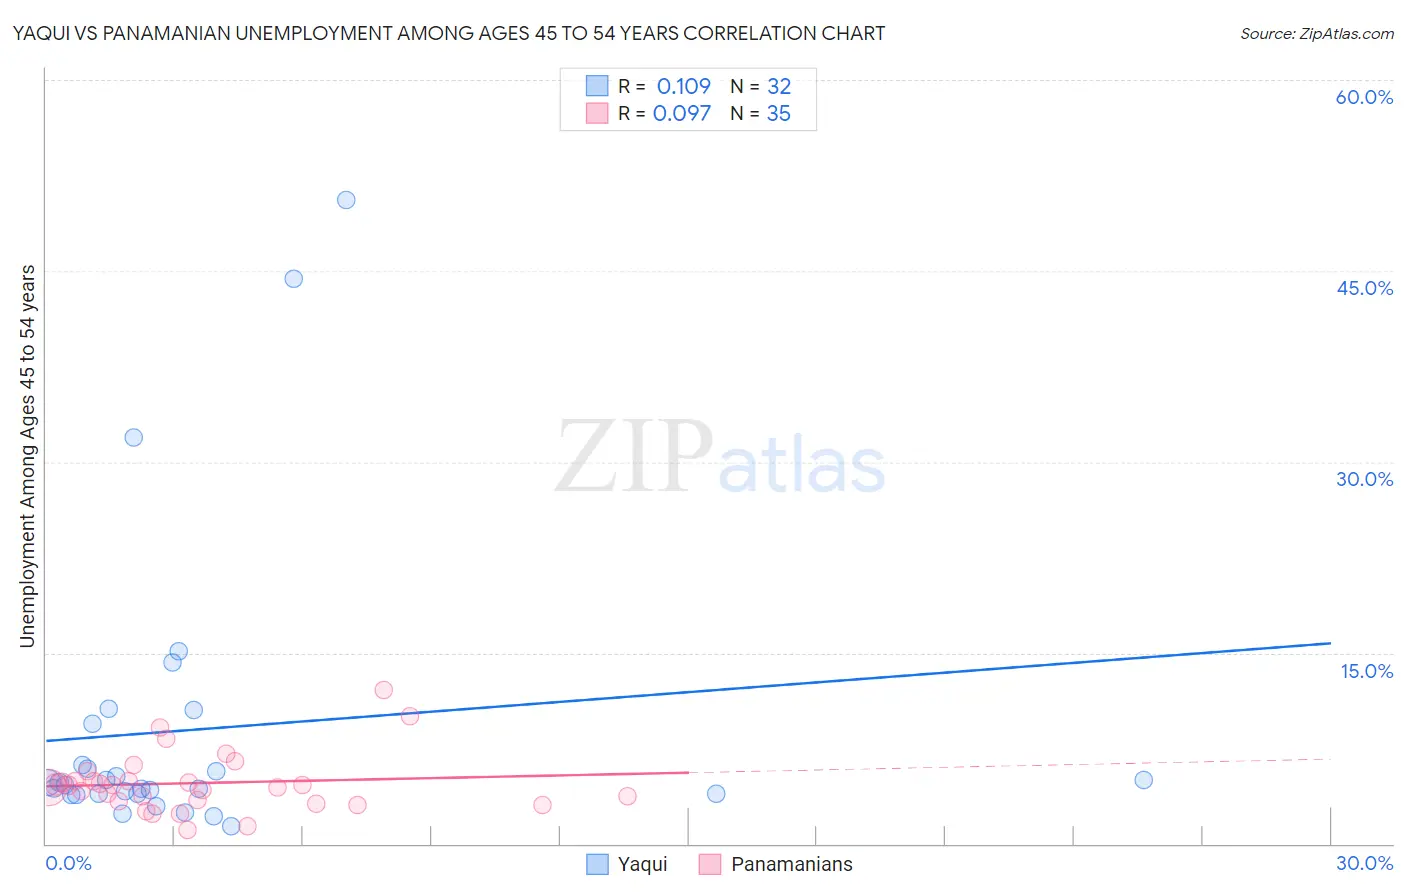
Yaqui vs Panamanian Unemployment Among Ages 45 to 54 years Correlation Chart
The statistical analysis conducted on geographies consisting of 106,913,738 people shows a poor positive correlation between the proportion of Yaqui and unemployment rate among population between the ages 45 and 54 in the United States with a correlation coefficient (R) of 0.109 and weighted average of 4.7%. Similarly, the statistical analysis conducted on geographies consisting of 277,014,987 people shows a slight positive correlation between the proportion of Panamanians and unemployment rate among population between the ages 45 and 54 in the United States with a correlation coefficient (R) of 0.097 and weighted average of 4.6%, a difference of 2.5%.
Unemployment Among Ages 45 to 54 years Correlation Summary
| Measurement | Yaqui | Panamanian |
| Minimum | 1.4% | 1.1% |
| Maximum | 50.6% | 12.1% |
| Range | 49.2% | 11.0% |
| Mean | 8.9% | 4.8% |
| Median | 4.7% | 4.6% |
| Interquartile 25% (IQ1) | 3.9% | 3.4% |
| Interquartile 75% (IQ3) | 7.8% | 4.9% |
| Interquartile Range (IQR) | 3.9% | 1.6% |
| Standard Deviation (Sample) | 11.6% | 2.3% |
| Standard Deviation (Population) | 11.4% | 2.3% |
Similar Demographics by Unemployment Among Ages 45 to 54 years
Demographics Similar to Yaqui by Unemployment Among Ages 45 to 54 years
In terms of unemployment among ages 45 to 54 years, the demographic groups most similar to Yaqui are Spanish American (4.7%, a difference of 0.0%), Immigrants from Iraq (4.7%, a difference of 0.030%), Delaware (4.8%, a difference of 0.10%), Central American (4.8%, a difference of 0.10%), and Alsatian (4.7%, a difference of 0.17%).
| Demographics | Rating | Rank | Unemployment Among Ages 45 to 54 years |
| Immigrants | Ireland | 2.7 /100 | #231 | Tragic 4.7% |
| Ottawa | 2.7 /100 | #232 | Tragic 4.7% |
| Immigrants | Immigrants | 2.6 /100 | #233 | Tragic 4.7% |
| Soviet Union | 2.6 /100 | #234 | Tragic 4.7% |
| Cree | 2.3 /100 | #235 | Tragic 4.7% |
| Tlingit-Haida | 2.3 /100 | #236 | Tragic 4.7% |
| Alsatians | 1.6 /100 | #237 | Tragic 4.7% |
| Yaqui | 1.4 /100 | #238 | Tragic 4.7% |
| Spanish Americans | 1.4 /100 | #239 | Tragic 4.7% |
| Immigrants | Iraq | 1.3 /100 | #240 | Tragic 4.7% |
| Delaware | 1.3 /100 | #241 | Tragic 4.8% |
| Central Americans | 1.3 /100 | #242 | Tragic 4.8% |
| Portuguese | 1.1 /100 | #243 | Tragic 4.8% |
| Seminole | 1.1 /100 | #244 | Tragic 4.8% |
| Immigrants | Albania | 0.9 /100 | #245 | Tragic 4.8% |
Demographics Similar to Panamanians by Unemployment Among Ages 45 to 54 years
In terms of unemployment among ages 45 to 54 years, the demographic groups most similar to Panamanians are Cherokee (4.6%, a difference of 0.020%), Immigrants from Panama (4.6%, a difference of 0.040%), Immigrants from Iran (4.6%, a difference of 0.090%), Creek (4.6%, a difference of 0.13%), and Immigrants from South America (4.6%, a difference of 0.17%).
| Demographics | Rating | Rank | Unemployment Among Ages 45 to 54 years |
| Immigrants | Switzerland | 14.0 /100 | #206 | Poor 4.6% |
| Arabs | 13.7 /100 | #207 | Poor 4.6% |
| Immigrants | Africa | 13.6 /100 | #208 | Poor 4.6% |
| Immigrants | Nigeria | 13.3 /100 | #209 | Poor 4.6% |
| Immigrants | South America | 12.2 /100 | #210 | Poor 4.6% |
| Creek | 11.9 /100 | #211 | Poor 4.6% |
| Immigrants | Iran | 11.5 /100 | #212 | Poor 4.6% |
| Panamanians | 10.7 /100 | #213 | Poor 4.6% |
| Cherokee | 10.6 /100 | #214 | Poor 4.6% |
| Immigrants | Panama | 10.4 /100 | #215 | Poor 4.6% |
| Lumbee | 9.2 /100 | #216 | Tragic 4.6% |
| Immigrants | Cambodia | 7.4 /100 | #217 | Tragic 4.7% |
| Immigrants | Uganda | 7.1 /100 | #218 | Tragic 4.7% |
| Nigerians | 7.0 /100 | #219 | Tragic 4.7% |
| Guamanians/Chamorros | 6.8 /100 | #220 | Tragic 4.7% |