Yakama vs Immigrants from Guatemala Unemployment Among Ages 35 to 44 years
COMPARE
Yakama
Immigrants from Guatemala
Unemployment Among Ages 35 to 44 years
Unemployment Among Ages 35 to 44 years Comparison
Yakama
Immigrants from Guatemala
5.6%
UNEMPLOYMENT AMONG AGES 35 TO 44 YEARS
0.0/ 100
METRIC RATING
303rd/ 347
METRIC RANK
5.2%
UNEMPLOYMENT AMONG AGES 35 TO 44 YEARS
0.4/ 100
METRIC RATING
246th/ 347
METRIC RANK
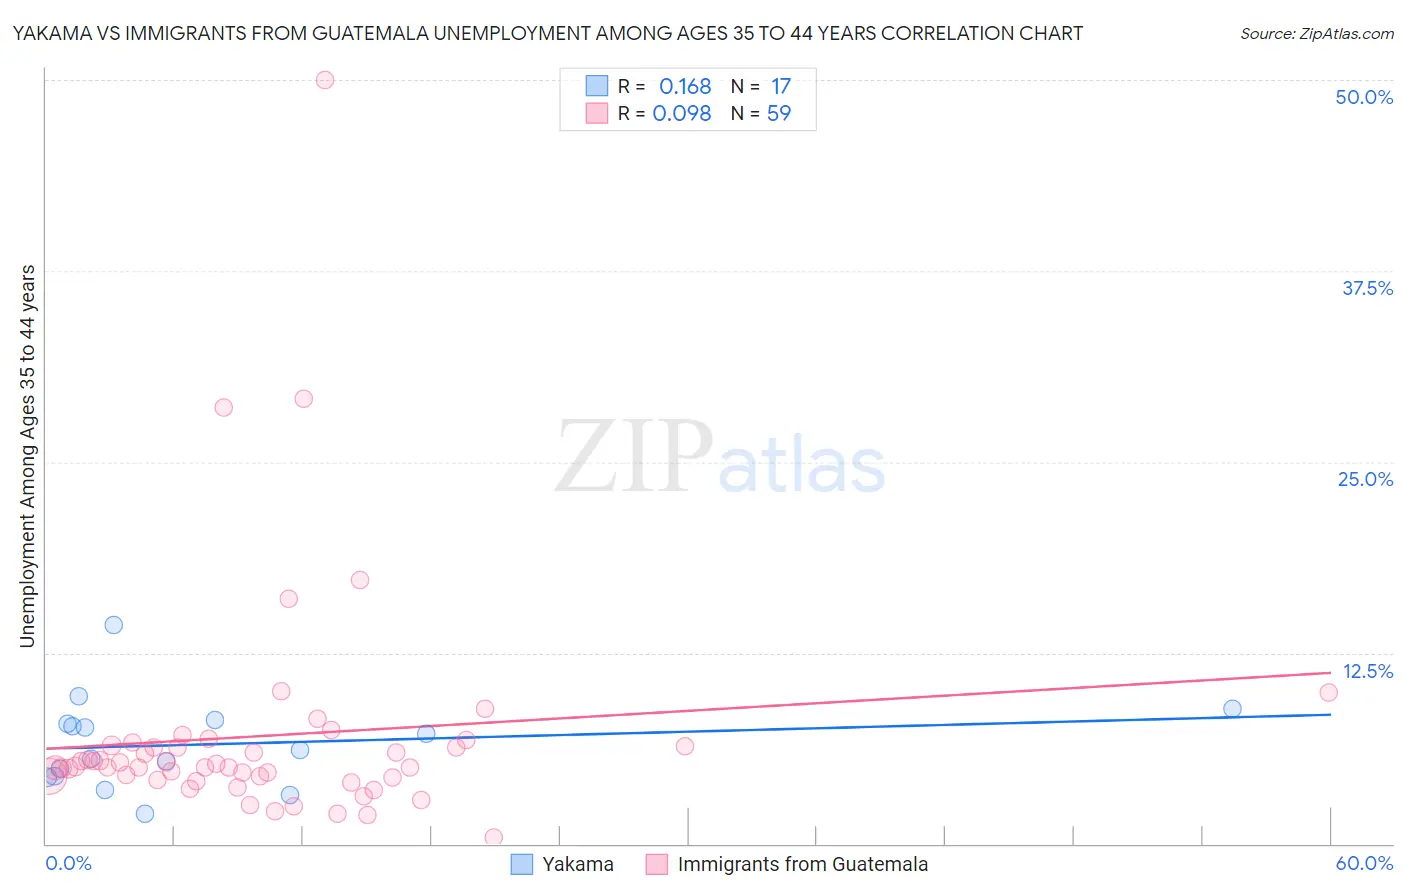
Yakama vs Immigrants from Guatemala Unemployment Among Ages 35 to 44 years Correlation Chart
The statistical analysis conducted on geographies consisting of 19,744,668 people shows a poor positive correlation between the proportion of Yakama and unemployment rate among population between the ages 35 and 44 in the United States with a correlation coefficient (R) of 0.168 and weighted average of 5.6%. Similarly, the statistical analysis conducted on geographies consisting of 370,619,643 people shows a slight positive correlation between the proportion of Immigrants from Guatemala and unemployment rate among population between the ages 35 and 44 in the United States with a correlation coefficient (R) of 0.098 and weighted average of 5.2%, a difference of 9.3%.
Unemployment Among Ages 35 to 44 years Correlation Summary
| Measurement | Yakama | Immigrants from Guatemala |
| Minimum | 2.0% | 0.40% |
| Maximum | 14.3% | 50.0% |
| Range | 12.3% | 49.6% |
| Mean | 6.5% | 7.1% |
| Median | 6.1% | 5.0% |
| Interquartile 25% (IQ1) | 4.4% | 4.3% |
| Interquartile 75% (IQ3) | 8.0% | 6.4% |
| Interquartile Range (IQR) | 3.6% | 2.1% |
| Standard Deviation (Sample) | 2.9% | 7.6% |
| Standard Deviation (Population) | 2.8% | 7.6% |
Similar Demographics by Unemployment Among Ages 35 to 44 years
Demographics Similar to Yakama by Unemployment Among Ages 35 to 44 years
In terms of unemployment among ages 35 to 44 years, the demographic groups most similar to Yakama are West Indian (5.7%, a difference of 0.26%), Belizean (5.7%, a difference of 0.40%), Nepalese (5.6%, a difference of 0.72%), African (5.6%, a difference of 0.85%), and Immigrants from West Indies (5.6%, a difference of 0.89%).
| Demographics | Rating | Rank | Unemployment Among Ages 35 to 44 years |
| Immigrants | Trinidad and Tobago | 0.0 /100 | #296 | Tragic 5.6% |
| U.S. Virgin Islanders | 0.0 /100 | #297 | Tragic 5.6% |
| Aleuts | 0.0 /100 | #298 | Tragic 5.6% |
| Immigrants | Jamaica | 0.0 /100 | #299 | Tragic 5.6% |
| Immigrants | West Indies | 0.0 /100 | #300 | Tragic 5.6% |
| Africans | 0.0 /100 | #301 | Tragic 5.6% |
| Nepalese | 0.0 /100 | #302 | Tragic 5.6% |
| Yakama | 0.0 /100 | #303 | Tragic 5.6% |
| West Indians | 0.0 /100 | #304 | Tragic 5.7% |
| Belizeans | 0.0 /100 | #305 | Tragic 5.7% |
| Barbadians | 0.0 /100 | #306 | Tragic 5.7% |
| Immigrants | Belize | 0.0 /100 | #307 | Tragic 5.8% |
| Immigrants | Azores | 0.0 /100 | #308 | Tragic 5.8% |
| Immigrants | Barbados | 0.0 /100 | #309 | Tragic 5.8% |
| Guyanese | 0.0 /100 | #310 | Tragic 5.9% |
Demographics Similar to Immigrants from Guatemala by Unemployment Among Ages 35 to 44 years
In terms of unemployment among ages 35 to 44 years, the demographic groups most similar to Immigrants from Guatemala are Bahamian (5.2%, a difference of 0.0%), Immigrants from Somalia (5.2%, a difference of 0.16%), Salvadoran (5.1%, a difference of 0.26%), Guatemalan (5.1%, a difference of 0.26%), and Delaware (5.1%, a difference of 0.38%).
| Demographics | Rating | Rank | Unemployment Among Ages 35 to 44 years |
| Nigerians | 0.7 /100 | #239 | Tragic 5.1% |
| Somalis | 0.7 /100 | #240 | Tragic 5.1% |
| Immigrants | Honduras | 0.6 /100 | #241 | Tragic 5.1% |
| Delaware | 0.5 /100 | #242 | Tragic 5.1% |
| Salvadorans | 0.4 /100 | #243 | Tragic 5.1% |
| Guatemalans | 0.4 /100 | #244 | Tragic 5.1% |
| Bahamians | 0.4 /100 | #245 | Tragic 5.2% |
| Immigrants | Guatemala | 0.4 /100 | #246 | Tragic 5.2% |
| Immigrants | Somalia | 0.3 /100 | #247 | Tragic 5.2% |
| Alsatians | 0.2 /100 | #248 | Tragic 5.2% |
| Immigrants | Liberia | 0.2 /100 | #249 | Tragic 5.2% |
| Immigrants | El Salvador | 0.2 /100 | #250 | Tragic 5.2% |
| Comanche | 0.2 /100 | #251 | Tragic 5.2% |
| Armenians | 0.2 /100 | #252 | Tragic 5.2% |
| Mexican American Indians | 0.2 /100 | #253 | Tragic 5.2% |