White/Caucasian vs Spaniard Unemployment Among Youth under 25 years
COMPARE
White/Caucasian
Spaniard
Unemployment Among Youth under 25 years
Unemployment Among Youth under 25 years Comparison
Whites/Caucasians
Spaniards
11.2%
UNEMPLOYMENT AMONG YOUTH UNDER 25 YEARS
96.9/ 100
METRIC RATING
77th/ 347
METRIC RANK
11.7%
UNEMPLOYMENT AMONG YOUTH UNDER 25 YEARS
39.8/ 100
METRIC RATING
180th/ 347
METRIC RANK
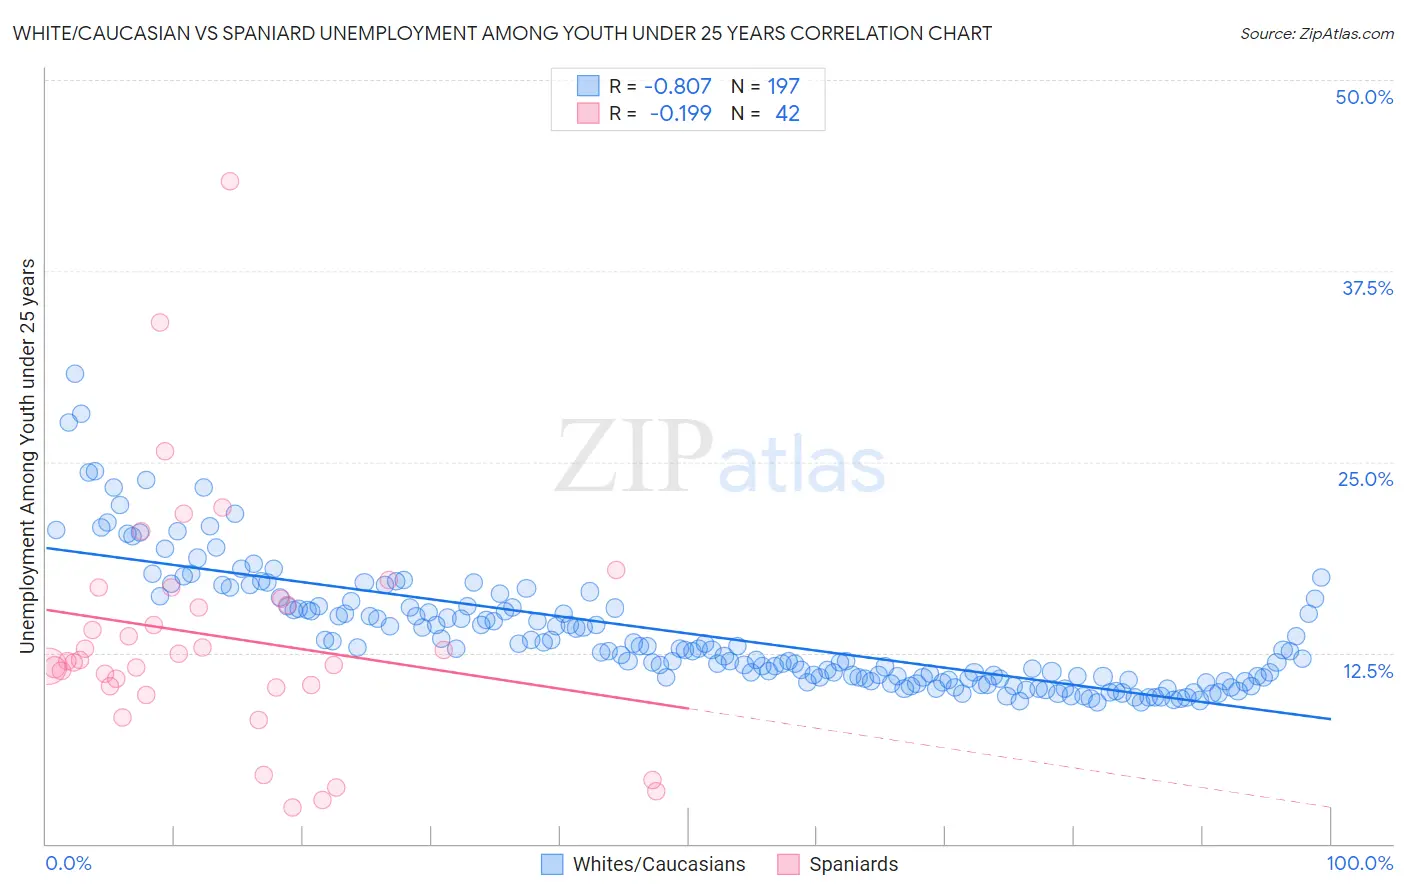
White/Caucasian vs Spaniard Unemployment Among Youth under 25 years Correlation Chart
The statistical analysis conducted on geographies consisting of 555,079,229 people shows a very strong negative correlation between the proportion of Whites/Caucasians and unemployment rate among youth under the age of 25 in the United States with a correlation coefficient (R) of -0.807 and weighted average of 11.2%. Similarly, the statistical analysis conducted on geographies consisting of 436,438,930 people shows a poor negative correlation between the proportion of Spaniards and unemployment rate among youth under the age of 25 in the United States with a correlation coefficient (R) of -0.199 and weighted average of 11.7%, a difference of 4.1%.
Unemployment Among Youth under 25 years Correlation Summary
| Measurement | White/Caucasian | Spaniard |
| Minimum | 9.2% | 2.4% |
| Maximum | 30.8% | 43.4% |
| Range | 21.5% | 41.0% |
| Mean | 13.7% | 13.6% |
| Median | 12.7% | 12.0% |
| Interquartile 25% (IQ1) | 10.8% | 10.3% |
| Interquartile 75% (IQ3) | 15.5% | 16.1% |
| Interquartile Range (IQR) | 4.7% | 5.8% |
| Standard Deviation (Sample) | 4.0% | 7.8% |
| Standard Deviation (Population) | 3.9% | 7.7% |
Similar Demographics by Unemployment Among Youth under 25 years
Demographics Similar to Whites/Caucasians by Unemployment Among Youth under 25 years
In terms of unemployment among youth under 25 years, the demographic groups most similar to Whites/Caucasians are German Russian (11.2%, a difference of 0.050%), Immigrants from Nicaragua (11.2%, a difference of 0.060%), Immigrants from Canada (11.2%, a difference of 0.070%), French (11.2%, a difference of 0.080%), and New Zealander (11.2%, a difference of 0.11%).
| Demographics | Rating | Rank | Unemployment Among Youth under 25 years |
| Slavs | 97.5 /100 | #70 | Exceptional 11.2% |
| Bhutanese | 97.4 /100 | #71 | Exceptional 11.2% |
| Immigrants | Australia | 97.3 /100 | #72 | Exceptional 11.2% |
| Creek | 97.2 /100 | #73 | Exceptional 11.2% |
| New Zealanders | 97.2 /100 | #74 | Exceptional 11.2% |
| French | 97.1 /100 | #75 | Exceptional 11.2% |
| German Russians | 97.0 /100 | #76 | Exceptional 11.2% |
| Whites/Caucasians | 96.9 /100 | #77 | Exceptional 11.2% |
| Immigrants | Nicaragua | 96.7 /100 | #78 | Exceptional 11.2% |
| Immigrants | Canada | 96.7 /100 | #79 | Exceptional 11.2% |
| Immigrants | Bulgaria | 96.4 /100 | #80 | Exceptional 11.2% |
| Icelanders | 96.3 /100 | #81 | Exceptional 11.2% |
| Northern Europeans | 96.2 /100 | #82 | Exceptional 11.2% |
| Bolivians | 96.1 /100 | #83 | Exceptional 11.2% |
| French Canadians | 95.9 /100 | #84 | Exceptional 11.2% |
Demographics Similar to Spaniards by Unemployment Among Youth under 25 years
In terms of unemployment among youth under 25 years, the demographic groups most similar to Spaniards are Syrian (11.7%, a difference of 0.060%), Immigrants from Europe (11.6%, a difference of 0.11%), Immigrants from Hong Kong (11.6%, a difference of 0.11%), Immigrants from Italy (11.7%, a difference of 0.16%), and Immigrants from Denmark (11.6%, a difference of 0.22%).
| Demographics | Rating | Rank | Unemployment Among Youth under 25 years |
| Immigrants | South Eastern Asia | 51.7 /100 | #173 | Average 11.6% |
| Immigrants | China | 50.0 /100 | #174 | Average 11.6% |
| Immigrants | Iraq | 47.0 /100 | #175 | Average 11.6% |
| Ugandans | 45.6 /100 | #176 | Average 11.6% |
| Immigrants | Denmark | 45.0 /100 | #177 | Average 11.6% |
| Immigrants | Europe | 42.4 /100 | #178 | Average 11.6% |
| Immigrants | Hong Kong | 42.4 /100 | #179 | Average 11.6% |
| Spaniards | 39.8 /100 | #180 | Fair 11.7% |
| Syrians | 38.4 /100 | #181 | Fair 11.7% |
| Immigrants | Italy | 36.2 /100 | #182 | Fair 11.7% |
| Americans | 34.5 /100 | #183 | Fair 11.7% |
| Immigrants | Eastern Europe | 34.1 /100 | #184 | Fair 11.7% |
| French American Indians | 34.0 /100 | #185 | Fair 11.7% |
| Maltese | 33.9 /100 | #186 | Fair 11.7% |
| Immigrants | Egypt | 31.9 /100 | #187 | Fair 11.7% |