White/Caucasian vs Black/African American Unemployment Among Ages 25 to 29 years
COMPARE
White/Caucasian
Black/African American
Unemployment Among Ages 25 to 29 years
Unemployment Among Ages 25 to 29 years Comparison
Whites/Caucasians
Blacks/African Americans
6.9%
UNEMPLOYMENT AMONG AGES 25 TO 29 YEARS
10.6/ 100
METRIC RATING
219th/ 347
METRIC RANK
8.6%
UNEMPLOYMENT AMONG AGES 25 TO 29 YEARS
0.0/ 100
METRIC RATING
320th/ 347
METRIC RANK
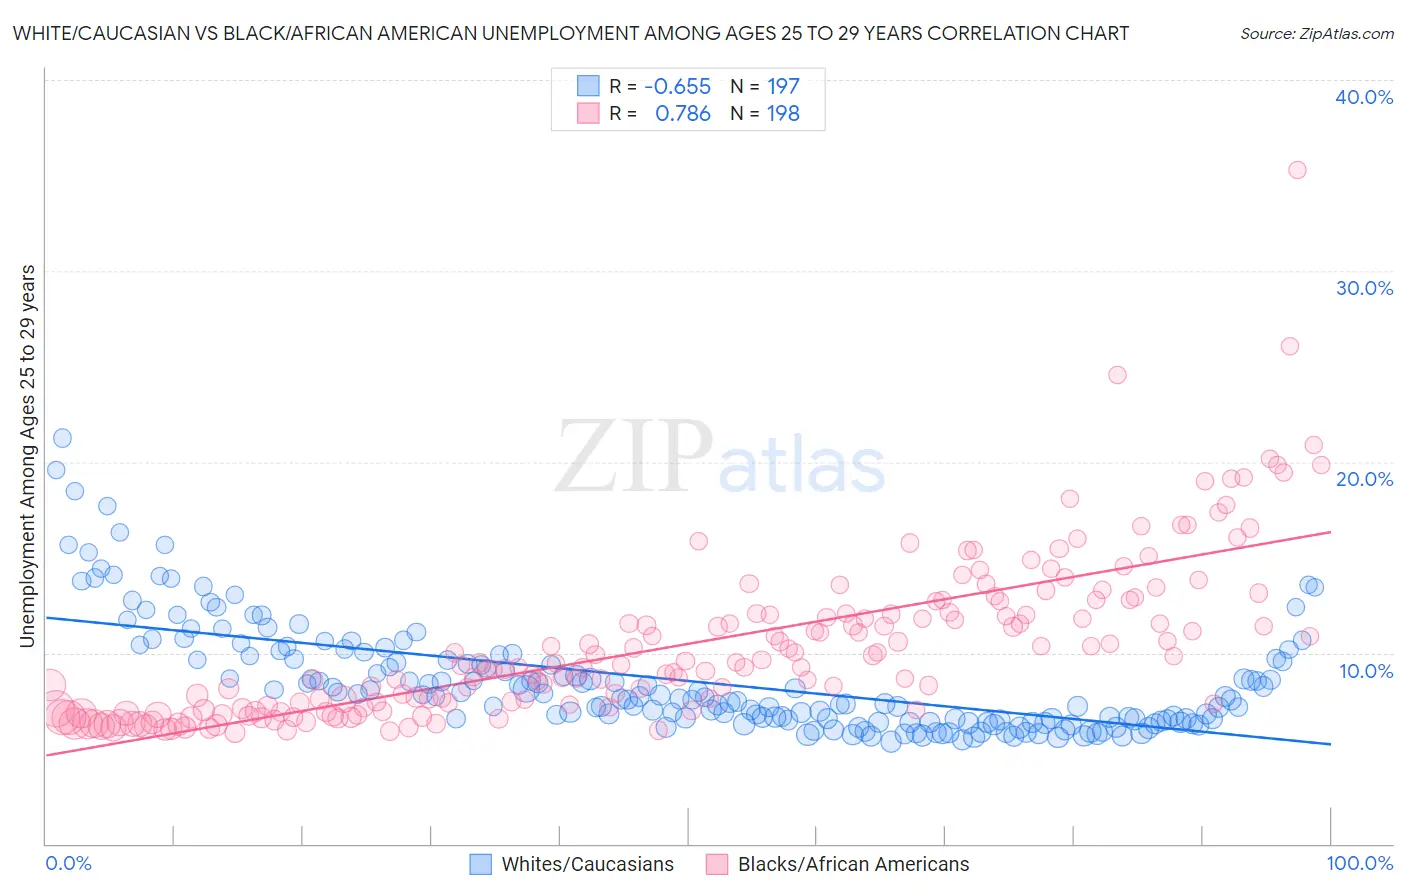
White/Caucasian vs Black/African American Unemployment Among Ages 25 to 29 years Correlation Chart
The statistical analysis conducted on geographies consisting of 513,309,764 people shows a significant negative correlation between the proportion of Whites/Caucasians and unemployment rate among population between the ages 25 and 29 in the United States with a correlation coefficient (R) of -0.655 and weighted average of 6.9%. Similarly, the statistical analysis conducted on geographies consisting of 507,749,487 people shows a strong positive correlation between the proportion of Blacks/African Americans and unemployment rate among population between the ages 25 and 29 in the United States with a correlation coefficient (R) of 0.786 and weighted average of 8.6%, a difference of 24.7%.
Unemployment Among Ages 25 to 29 years Correlation Summary
| Measurement | White/Caucasian | Black/African American |
| Minimum | 5.3% | 5.8% |
| Maximum | 21.2% | 35.3% |
| Range | 15.9% | 29.5% |
| Mean | 8.5% | 10.4% |
| Median | 7.7% | 9.3% |
| Interquartile 25% (IQ1) | 6.5% | 7.1% |
| Interquartile 75% (IQ3) | 9.8% | 12.0% |
| Interquartile Range (IQR) | 3.3% | 5.0% |
| Standard Deviation (Sample) | 2.9% | 4.3% |
| Standard Deviation (Population) | 2.9% | 4.3% |
Similar Demographics by Unemployment Among Ages 25 to 29 years
Demographics Similar to Whites/Caucasians by Unemployment Among Ages 25 to 29 years
In terms of unemployment among ages 25 to 29 years, the demographic groups most similar to Whites/Caucasians are French (6.9%, a difference of 0.010%), Israeli (6.9%, a difference of 0.13%), Immigrants from Austria (6.8%, a difference of 0.26%), Ute (6.8%, a difference of 0.40%), and Slovak (6.8%, a difference of 0.51%).
| Demographics | Rating | Rank | Unemployment Among Ages 25 to 29 years |
| Immigrants | Cabo Verde | 16.2 /100 | #212 | Poor 6.8% |
| Immigrants | Syria | 15.1 /100 | #213 | Poor 6.8% |
| Liberians | 14.7 /100 | #214 | Poor 6.8% |
| Spanish | 14.4 /100 | #215 | Poor 6.8% |
| Slovaks | 14.3 /100 | #216 | Poor 6.8% |
| Ute | 13.4 /100 | #217 | Poor 6.8% |
| Immigrants | Austria | 12.3 /100 | #218 | Poor 6.8% |
| Whites/Caucasians | 10.6 /100 | #219 | Poor 6.9% |
| French | 10.5 /100 | #220 | Poor 6.9% |
| Israelis | 9.8 /100 | #221 | Tragic 6.9% |
| Spaniards | 7.7 /100 | #222 | Tragic 6.9% |
| Celtics | 7.6 /100 | #223 | Tragic 6.9% |
| Immigrants | Immigrants | 6.2 /100 | #224 | Tragic 6.9% |
| Japanese | 5.4 /100 | #225 | Tragic 6.9% |
| Immigrants | Liberia | 4.8 /100 | #226 | Tragic 7.0% |
Demographics Similar to Blacks/African Americans by Unemployment Among Ages 25 to 29 years
In terms of unemployment among ages 25 to 29 years, the demographic groups most similar to Blacks/African Americans are Immigrants from Dominican Republic (8.6%, a difference of 0.61%), Immigrants from Armenia (8.5%, a difference of 0.74%), Guyanese (8.5%, a difference of 0.97%), Immigrants from Guyana (8.5%, a difference of 1.2%), and Immigrants from Grenada (8.4%, a difference of 1.3%).
| Demographics | Rating | Rank | Unemployment Among Ages 25 to 29 years |
| Immigrants | St. Vincent and the Grenadines | 0.0 /100 | #313 | Tragic 8.4% |
| Immigrants | Dominica | 0.0 /100 | #314 | Tragic 8.4% |
| British West Indians | 0.0 /100 | #315 | Tragic 8.4% |
| Immigrants | Grenada | 0.0 /100 | #316 | Tragic 8.4% |
| Immigrants | Guyana | 0.0 /100 | #317 | Tragic 8.5% |
| Guyanese | 0.0 /100 | #318 | Tragic 8.5% |
| Immigrants | Armenia | 0.0 /100 | #319 | Tragic 8.5% |
| Blacks/African Americans | 0.0 /100 | #320 | Tragic 8.6% |
| Immigrants | Dominican Republic | 0.0 /100 | #321 | Tragic 8.6% |
| Tlingit-Haida | 0.0 /100 | #322 | Tragic 8.7% |
| Dominicans | 0.0 /100 | #323 | Tragic 8.7% |
| Houma | 0.0 /100 | #324 | Tragic 8.7% |
| Yakama | 0.0 /100 | #325 | Tragic 8.8% |
| Shoshone | 0.0 /100 | #326 | Tragic 9.2% |
| Colville | 0.0 /100 | #327 | Tragic 9.2% |