West Indian vs Sudanese Unemployment Among Youth under 25 years
COMPARE
West Indian
Sudanese
Unemployment Among Youth under 25 years
Unemployment Among Youth under 25 years Comparison
West Indians
Sudanese
14.6%
UNEMPLOYMENT AMONG YOUTH UNDER 25 YEARS
0.0/ 100
METRIC RATING
319th/ 347
METRIC RANK
10.6%
UNEMPLOYMENT AMONG YOUTH UNDER 25 YEARS
100.0/ 100
METRIC RATING
15th/ 347
METRIC RANK
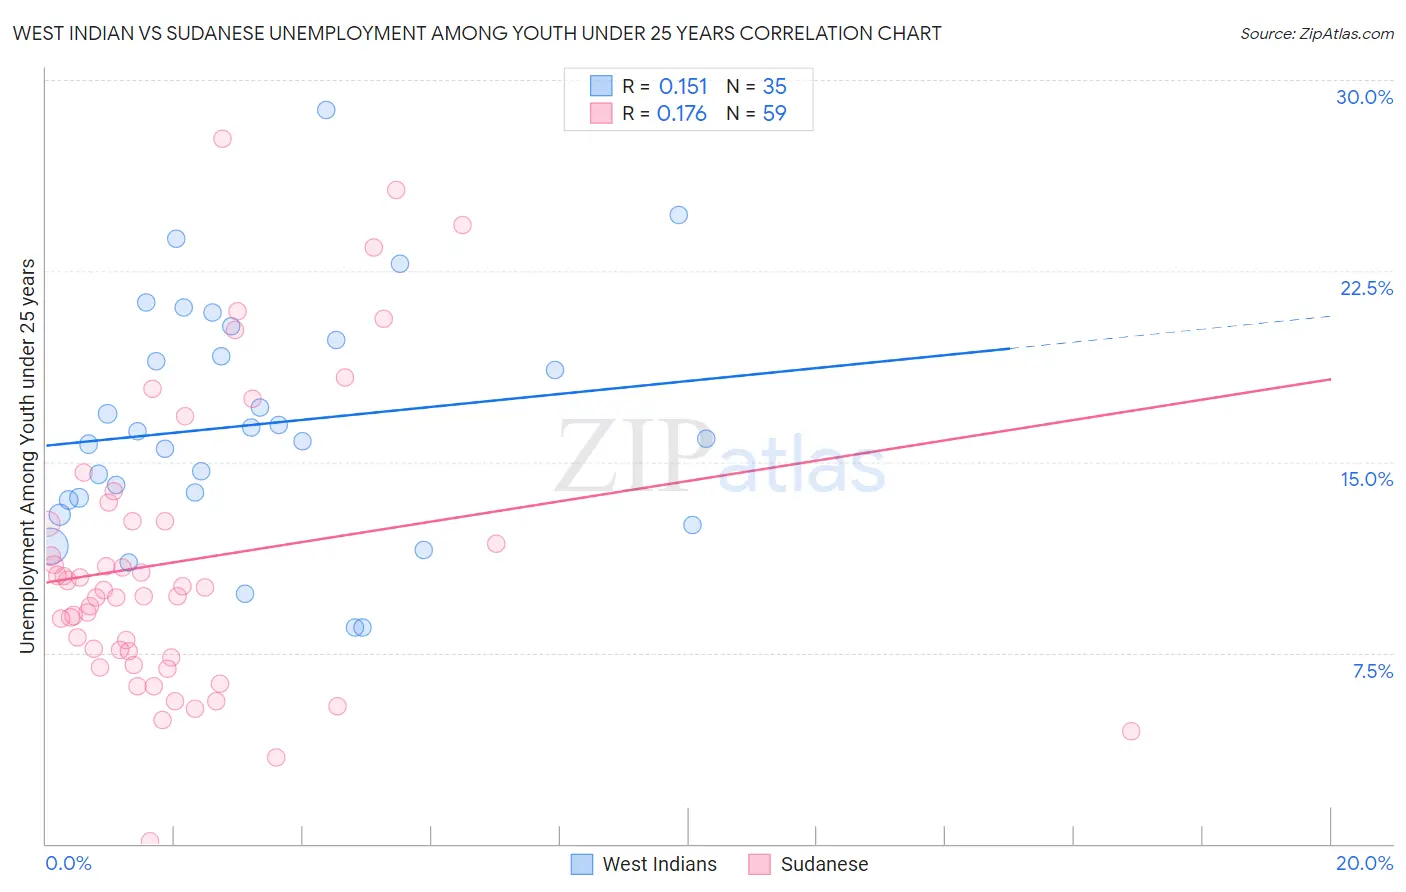
West Indian vs Sudanese Unemployment Among Youth under 25 years Correlation Chart
The statistical analysis conducted on geographies consisting of 252,611,968 people shows a poor positive correlation between the proportion of West Indians and unemployment rate among youth under the age of 25 in the United States with a correlation coefficient (R) of 0.151 and weighted average of 14.6%. Similarly, the statistical analysis conducted on geographies consisting of 109,885,250 people shows a poor positive correlation between the proportion of Sudanese and unemployment rate among youth under the age of 25 in the United States with a correlation coefficient (R) of 0.176 and weighted average of 10.6%, a difference of 37.9%.
Unemployment Among Youth under 25 years Correlation Summary
| Measurement | West Indian | Sudanese |
| Minimum | 8.5% | 0.10% |
| Maximum | 28.8% | 27.7% |
| Range | 20.3% | 27.6% |
| Mean | 16.5% | 11.1% |
| Median | 15.9% | 10.0% |
| Interquartile 25% (IQ1) | 13.5% | 7.3% |
| Interquartile 75% (IQ3) | 19.8% | 12.7% |
| Interquartile Range (IQR) | 6.3% | 5.4% |
| Standard Deviation (Sample) | 4.7% | 5.7% |
| Standard Deviation (Population) | 4.6% | 5.7% |
Similar Demographics by Unemployment Among Youth under 25 years
Demographics Similar to West Indians by Unemployment Among Youth under 25 years
In terms of unemployment among youth under 25 years, the demographic groups most similar to West Indians are Immigrants from Dominica (14.6%, a difference of 0.040%), Barbadian (14.6%, a difference of 0.040%), Cheyenne (14.6%, a difference of 0.20%), Trinidadian and Tobagonian (14.6%, a difference of 0.27%), and Immigrants from Trinidad and Tobago (14.6%, a difference of 0.36%).
| Demographics | Rating | Rank | Unemployment Among Youth under 25 years |
| Vietnamese | 0.0 /100 | #312 | Tragic 14.3% |
| Immigrants | Armenia | 0.0 /100 | #313 | Tragic 14.4% |
| Jamaicans | 0.0 /100 | #314 | Tragic 14.4% |
| Sioux | 0.0 /100 | #315 | Tragic 14.4% |
| Natives/Alaskans | 0.0 /100 | #316 | Tragic 14.5% |
| Blacks/African Americans | 0.0 /100 | #317 | Tragic 14.5% |
| Immigrants | Dominica | 0.0 /100 | #318 | Tragic 14.6% |
| West Indians | 0.0 /100 | #319 | Tragic 14.6% |
| Barbadians | 0.0 /100 | #320 | Tragic 14.6% |
| Cheyenne | 0.0 /100 | #321 | Tragic 14.6% |
| Trinidadians and Tobagonians | 0.0 /100 | #322 | Tragic 14.6% |
| Immigrants | Trinidad and Tobago | 0.0 /100 | #323 | Tragic 14.6% |
| Immigrants | Jamaica | 0.0 /100 | #324 | Tragic 14.8% |
| Alaska Natives | 0.0 /100 | #325 | Tragic 14.9% |
| Immigrants | Barbados | 0.0 /100 | #326 | Tragic 15.2% |
Demographics Similar to Sudanese by Unemployment Among Youth under 25 years
In terms of unemployment among youth under 25 years, the demographic groups most similar to Sudanese are Venezuelan (10.6%, a difference of 0.010%), Menominee (10.6%, a difference of 0.050%), Cuban (10.6%, a difference of 0.12%), Indonesian (10.6%, a difference of 0.13%), and Swiss (10.6%, a difference of 0.21%).
| Demographics | Rating | Rank | Unemployment Among Youth under 25 years |
| Immigrants | Venezuela | 100.0 /100 | #8 | Exceptional 10.5% |
| Germans | 100.0 /100 | #9 | Exceptional 10.5% |
| Immigrants | Somalia | 100.0 /100 | #10 | Exceptional 10.5% |
| Scandinavians | 100.0 /100 | #11 | Exceptional 10.5% |
| Immigrants | Sudan | 100.0 /100 | #12 | Exceptional 10.5% |
| Indonesians | 100.0 /100 | #13 | Exceptional 10.6% |
| Cubans | 100.0 /100 | #14 | Exceptional 10.6% |
| Sudanese | 100.0 /100 | #15 | Exceptional 10.6% |
| Venezuelans | 100.0 /100 | #16 | Exceptional 10.6% |
| Menominee | 100.0 /100 | #17 | Exceptional 10.6% |
| Swiss | 100.0 /100 | #18 | Exceptional 10.6% |
| Immigrants | Burma/Myanmar | 100.0 /100 | #19 | Exceptional 10.6% |
| Dutch | 100.0 /100 | #20 | Exceptional 10.6% |
| Pennsylvania Germans | 100.0 /100 | #21 | Exceptional 10.6% |
| Belgians | 100.0 /100 | #22 | Exceptional 10.6% |