Welsh vs Spaniard Unemployment Among Women with Children Ages 6 to 17 years
COMPARE
Welsh
Spaniard
Unemployment Among Women with Children Ages 6 to 17 years
Unemployment Among Women with Children Ages 6 to 17 years Comparison
Welsh
Spaniards
9.3%
UNEMPLOYMENT AMONG WOMEN WITH CHILDREN AGES 6 TO 17 YEARS
4.0/ 100
METRIC RATING
230th/ 347
METRIC RANK
9.2%
UNEMPLOYMENT AMONG WOMEN WITH CHILDREN AGES 6 TO 17 YEARS
8.2/ 100
METRIC RATING
213th/ 347
METRIC RANK
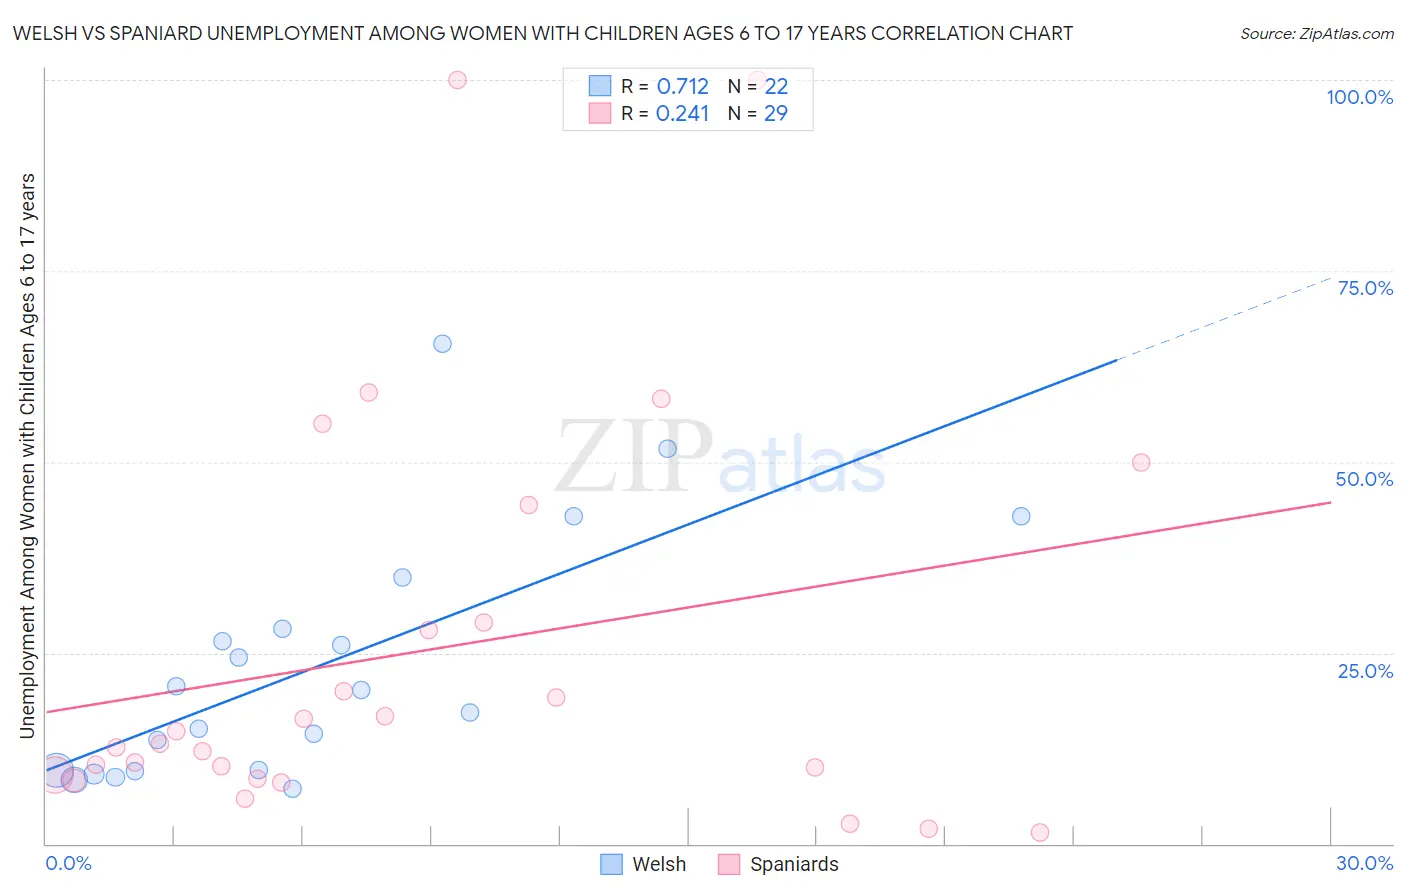
Welsh vs Spaniard Unemployment Among Women with Children Ages 6 to 17 years Correlation Chart
The statistical analysis conducted on geographies consisting of 338,386,980 people shows a strong positive correlation between the proportion of Welsh and unemployment rate among women with children between the ages 6 and 17 in the United States with a correlation coefficient (R) of 0.712 and weighted average of 9.3%. Similarly, the statistical analysis conducted on geographies consisting of 311,847,590 people shows a weak positive correlation between the proportion of Spaniards and unemployment rate among women with children between the ages 6 and 17 in the United States with a correlation coefficient (R) of 0.241 and weighted average of 9.2%, a difference of 0.83%.
Unemployment Among Women with Children Ages 6 to 17 years Correlation Summary
| Measurement | Welsh | Spaniard |
| Minimum | 7.2% | 1.4% |
| Maximum | 65.4% | 100.0% |
| Range | 58.2% | 98.6% |
| Mean | 23.0% | 25.4% |
| Median | 18.6% | 13.1% |
| Interquartile 25% (IQ1) | 9.7% | 8.7% |
| Interquartile 75% (IQ3) | 28.2% | 36.7% |
| Interquartile Range (IQR) | 18.5% | 27.9% |
| Standard Deviation (Sample) | 15.9% | 26.8% |
| Standard Deviation (Population) | 15.5% | 26.3% |
Demographics Similar to Welsh and Spaniards by Unemployment Among Women with Children Ages 6 to 17 years
In terms of unemployment among women with children ages 6 to 17 years, the demographic groups most similar to Welsh are Macedonian (9.3%, a difference of 0.010%), Lumbee (9.3%, a difference of 0.090%), Estonian (9.3%, a difference of 0.13%), Panamanian (9.3%, a difference of 0.15%), and Immigrants from the Azores (9.3%, a difference of 0.17%). Similarly, the demographic groups most similar to Spaniards are Iroquois (9.2%, a difference of 0.10%), Peruvian (9.2%, a difference of 0.11%), Immigrants from Germany (9.2%, a difference of 0.14%), Immigrants from Uruguay (9.2%, a difference of 0.14%), and German (9.2%, a difference of 0.15%).
| Demographics | Rating | Rank | Unemployment Among Women with Children Ages 6 to 17 years |
| Immigrants | Cuba | 9.6 /100 | #211 | Tragic 9.2% |
| Peruvians | 9.0 /100 | #212 | Tragic 9.2% |
| Spaniards | 8.2 /100 | #213 | Tragic 9.2% |
| Iroquois | 7.5 /100 | #214 | Tragic 9.2% |
| Immigrants | Germany | 7.2 /100 | #215 | Tragic 9.2% |
| Immigrants | Uruguay | 7.2 /100 | #216 | Tragic 9.2% |
| Germans | 7.2 /100 | #217 | Tragic 9.2% |
| Syrians | 6.9 /100 | #218 | Tragic 9.2% |
| Immigrants | Scotland | 6.6 /100 | #219 | Tragic 9.2% |
| Belgians | 6.4 /100 | #220 | Tragic 9.2% |
| Crow | 5.8 /100 | #221 | Tragic 9.2% |
| Immigrants | Southern Europe | 5.8 /100 | #222 | Tragic 9.2% |
| Immigrants | Eritrea | 5.8 /100 | #223 | Tragic 9.2% |
| Immigrants | El Salvador | 5.3 /100 | #224 | Tragic 9.3% |
| Chinese | 5.2 /100 | #225 | Tragic 9.3% |
| Immigrants | Azores | 4.6 /100 | #226 | Tragic 9.3% |
| Panamanians | 4.5 /100 | #227 | Tragic 9.3% |
| Estonians | 4.4 /100 | #228 | Tragic 9.3% |
| Lumbee | 4.3 /100 | #229 | Tragic 9.3% |
| Welsh | 4.0 /100 | #230 | Tragic 9.3% |
| Macedonians | 3.9 /100 | #231 | Tragic 9.3% |