Vietnamese vs Ottawa Unemployment Among Ages 30 to 34 years
COMPARE
Vietnamese
Ottawa
Unemployment Among Ages 30 to 34 years
Unemployment Among Ages 30 to 34 years Comparison
Vietnamese
Ottawa
6.5%
UNEMPLOYMENT AMONG AGES 30 TO 34 YEARS
0.0/ 100
METRIC RATING
292nd/ 347
METRIC RANK
6.3%
UNEMPLOYMENT AMONG AGES 30 TO 34 YEARS
0.0/ 100
METRIC RATING
273rd/ 347
METRIC RANK
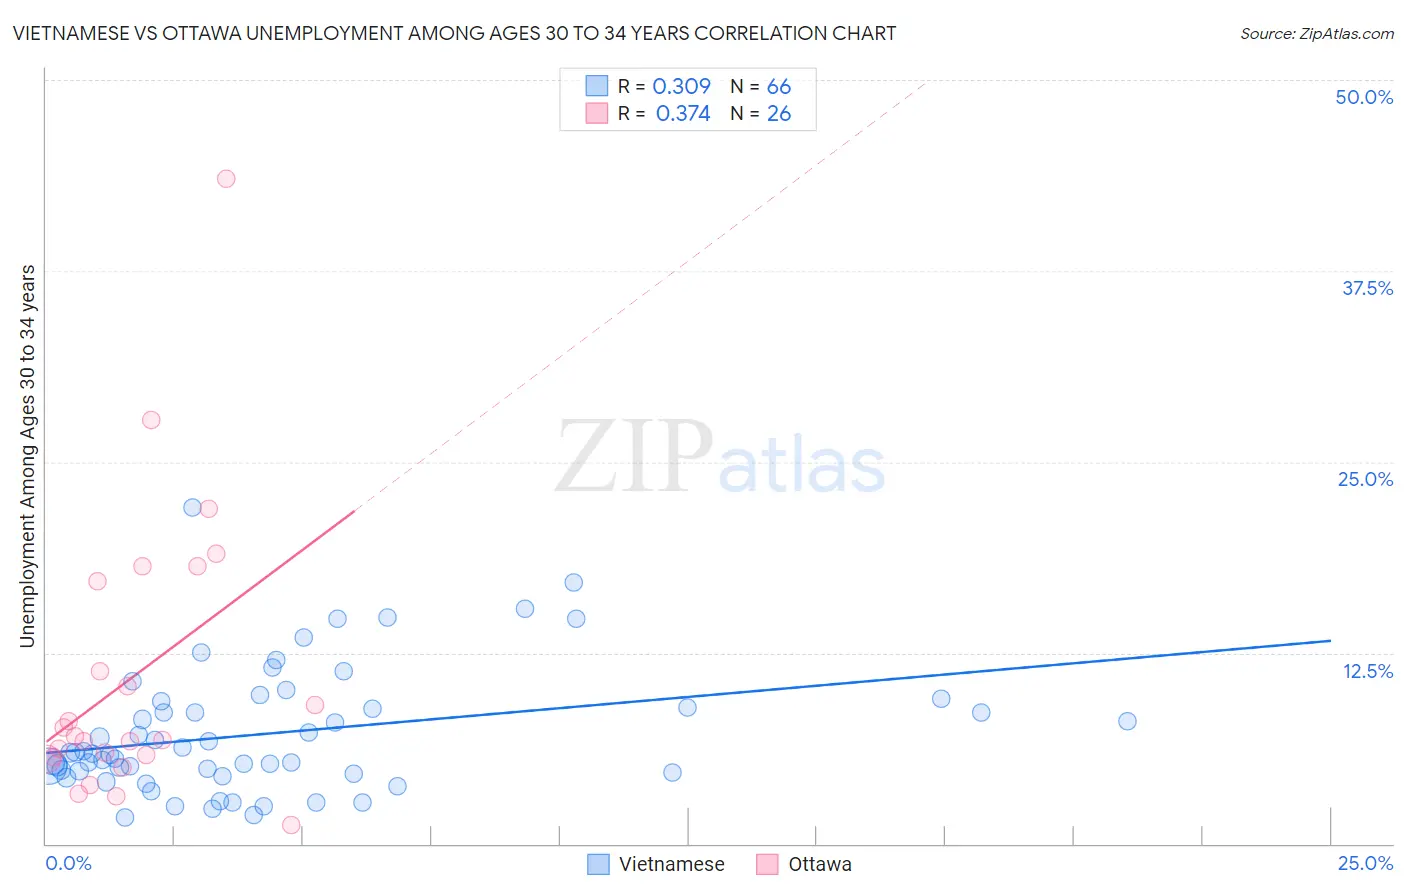
Vietnamese vs Ottawa Unemployment Among Ages 30 to 34 years Correlation Chart
The statistical analysis conducted on geographies consisting of 167,594,884 people shows a mild positive correlation between the proportion of Vietnamese and unemployment rate among population between the ages 30 and 34 in the United States with a correlation coefficient (R) of 0.309 and weighted average of 6.5%. Similarly, the statistical analysis conducted on geographies consisting of 48,740,680 people shows a mild positive correlation between the proportion of Ottawa and unemployment rate among population between the ages 30 and 34 in the United States with a correlation coefficient (R) of 0.374 and weighted average of 6.3%, a difference of 3.5%.
Unemployment Among Ages 30 to 34 years Correlation Summary
| Measurement | Vietnamese | Ottawa |
| Minimum | 1.8% | 1.2% |
| Maximum | 22.0% | 43.5% |
| Range | 20.2% | 42.3% |
| Mean | 7.2% | 11.0% |
| Median | 5.9% | 6.9% |
| Interquartile 25% (IQ1) | 4.7% | 5.7% |
| Interquartile 75% (IQ3) | 8.9% | 17.2% |
| Interquartile Range (IQR) | 4.2% | 11.5% |
| Standard Deviation (Sample) | 4.1% | 9.4% |
| Standard Deviation (Population) | 4.0% | 9.2% |
Demographics Similar to Vietnamese and Ottawa by Unemployment Among Ages 30 to 34 years
In terms of unemployment among ages 30 to 34 years, the demographic groups most similar to Vietnamese are Jamaican (6.5%, a difference of 0.27%), Immigrants from Trinidad and Tobago (6.5%, a difference of 0.56%), Menominee (6.4%, a difference of 0.94%), Senegalese (6.4%, a difference of 0.99%), and Immigrants from West Indies (6.4%, a difference of 1.0%). Similarly, the demographic groups most similar to Ottawa are Blackfeet (6.3%, a difference of 0.010%), U.S. Virgin Islander (6.3%, a difference of 0.010%), Ecuadorian (6.3%, a difference of 0.11%), Pennsylvania German (6.3%, a difference of 0.17%), and Immigrants from Ecuador (6.3%, a difference of 0.90%).
| Demographics | Rating | Rank | Unemployment Among Ages 30 to 34 years |
| Blackfeet | 0.0 /100 | #272 | Tragic 6.3% |
| Ottawa | 0.0 /100 | #273 | Tragic 6.3% |
| U.S. Virgin Islanders | 0.0 /100 | #274 | Tragic 6.3% |
| Ecuadorians | 0.0 /100 | #275 | Tragic 6.3% |
| Pennsylvania Germans | 0.0 /100 | #276 | Tragic 6.3% |
| Immigrants | Ecuador | 0.0 /100 | #277 | Tragic 6.3% |
| Osage | 0.0 /100 | #278 | Tragic 6.3% |
| Cree | 0.0 /100 | #279 | Tragic 6.4% |
| Cherokee | 0.0 /100 | #280 | Tragic 6.4% |
| Immigrants | Caribbean | 0.0 /100 | #281 | Tragic 6.4% |
| Africans | 0.0 /100 | #282 | Tragic 6.4% |
| Hispanics or Latinos | 0.0 /100 | #283 | Tragic 6.4% |
| Immigrants | Bangladesh | 0.0 /100 | #284 | Tragic 6.4% |
| Choctaw | 0.0 /100 | #285 | Tragic 6.4% |
| Central American Indians | 0.0 /100 | #286 | Tragic 6.4% |
| Immigrants | West Indies | 0.0 /100 | #287 | Tragic 6.4% |
| Senegalese | 0.0 /100 | #288 | Tragic 6.4% |
| Menominee | 0.0 /100 | #289 | Tragic 6.4% |
| Immigrants | Trinidad and Tobago | 0.0 /100 | #290 | Tragic 6.5% |
| Jamaicans | 0.0 /100 | #291 | Tragic 6.5% |
| Vietnamese | 0.0 /100 | #292 | Tragic 6.5% |