Vietnamese vs Comanche Unemployment Among Youth under 25 years

COMPARE

Vietnamese
Race
Ancestry
AfghanAfricanAlaska NativeAlaskan AthabascanAlbanianAleutAlsatianAmericanApacheArabArapahoArgentineanArmenianAssyrian/Chaldean/SyriacAustralianAustrianBahamianBangladeshiBarbadianBasqueBelgianBelizeanBermudanBhutaneseBlackfeetBolivianBrazilianBritishBritish West IndianBulgarianBurmeseCajunCambodianCanadianCape VerdeanCarpatho RusynCelticCentral AmericanCentral American IndianCherokeeCheyenneChickasawChileanChineseChippewaChoctawColombianColvilleCosta RicanCreeCreekCroatianCrowCubanCypriotCzechCzechoslovakianDanishDelawareDominicanDutchDutch West IndianEastern EuropeanEcuadorianEgyptianEnglishEstonianEthiopianEuropeanFijianFilipinoFinnishFrenchFrench American IndianFrench CanadianGermanGerman RussianGhanaianGreekGuamanian/ChamorroGuatemalanGuyaneseHaitianHmongHonduranHopiHoumaHungarianIcelanderIndian (Asian)IndonesianInupiatIranianIraqiIrishIroquoisIsraeliItalianJamaicanJapaneseJordanianKenyanKiowaKoreanLaotianLatvianLebaneseLiberianLithuanianLumbeeLuxembourgerMacedonianMalaysianMalteseMarshalleseMenomineeMexicanMexican American IndianMongolianMoroccanNative HawaiianNavajoNepaleseNew ZealanderNicaraguanNigerianNorthern EuropeanNorwegianOkinawanOsageOttawaPaiutePakistaniPalestinianPanamanianParaguayanPennsylvania GermanPeruvianPimaPolishPortuguesePotawatomiPuebloPuerto RicanPuget Sound SalishRomanianRussianSalvadoranSamoanScandinavianScotch-IrishScottishSeminoleSenegaleseSerbianShoshoneSierra LeoneanSiouxSlavicSlovakSloveneSomaliSouth AfricanSouth AmericanSouth American IndianSoviet UnionSpaniardSpanishSpanish AmericanSpanish American IndianSri LankanSubsaharan AfricanSudaneseSwedishSwissSyrianTaiwaneseThaiTlingit-HaidaTohono O'OdhamTonganTrinidadian and TobagonianTsimshianTurkishU.S. Virgin IslanderUgandanUkrainianUruguayanUteVenezuelanVietnameseWelshWest IndianYakamaYaquiYugoslavianYumanYup'ikZimbabwean
Immigration
NonimmigrantsImmigrantsAfghanistanAfricaAlbaniaArgentinaArmeniaAsiaAustraliaAustriaBahamasBangladeshBarbadosBelarusBelgiumBelizeBoliviaBosnia and HerzegovinaBrazilBulgariaBurma/MyanmarCabo VerdeCambodiaCameroonCanadaCaribbeanCentral AmericaChileChinaColombiaCongoCosta RicaCroatiaCubaCzechoslovakiaDenmarkDominicaDominican RepublicEastern AfricaEastern AsiaEastern EuropeEcuadorEgyptEl SalvadorEnglandEritreaEthiopiaEuropeFijiFranceGermanyGhanaGreeceGrenadaGuatemalaGuyanaHaitiHondurasHong KongHungaryIndiaIndonesiaIranIraqIrelandIsraelItalyJamaicaJapanJordanKazakhstanKenyaKoreaKuwaitLaosLatin AmericaLatviaLebanonLiberiaLithuaniaMalaysiaMexicoMicronesiaMiddle AfricaMoldovaMoroccoNepalNetherlandsNicaraguaNigeriaNorth AmericaNorth MacedoniaNorthern AfricaNorthern EuropeNorwayOceaniaPakistanPanamaPeruPhilippinesPolandPortugalRomaniaRussiaSaudi ArabiaScotlandSenegalSerbiaSierra LeoneSingaporeSomaliaSouth AfricaSouth AmericaSouth Central AsiaSouth Eastern AsiaSouthern EuropeSpainSri LankaSt. Vincent and the GrenadinesSudanSwedenSwitzerlandSyriaTaiwanThailandTrinidad and TobagoTurkeyUgandaUkraineUruguayUzbekistanVenezuelaVietnamWest IndiesWestern AfricaWestern AsiaWestern EuropeYemenZaireZimbabweAzores
Comanche
Race
Ancestry
AfghanAfricanAlaska NativeAlaskan AthabascanAlbanianAleutAlsatianAmericanApacheArabArapahoArgentineanArmenianAssyrian/Chaldean/SyriacAustralianAustrianBahamianBangladeshiBarbadianBasqueBelgianBelizeanBermudanBhutaneseBlackfeetBolivianBrazilianBritishBritish West IndianBulgarianBurmeseCajunCambodianCanadianCape VerdeanCarpatho RusynCelticCentral AmericanCentral American IndianCherokeeCheyenneChickasawChileanChineseChippewaChoctawColombianColvilleComancheCosta RicanCreeCreekCroatianCrowCubanCypriotCzechCzechoslovakianDanishDelawareDominicanDutchDutch West IndianEastern EuropeanEcuadorianEgyptianEnglishEstonianEthiopianEuropeanFijianFilipinoFinnishFrenchFrench American IndianFrench CanadianGermanGerman RussianGhanaianGreekGuamanian/ChamorroGuatemalanGuyaneseHaitianHmongHonduranHopiHoumaHungarianIcelanderIndian (Asian)IndonesianInupiatIranianIraqiIrishIroquoisIsraeliItalianJamaicanJapaneseJordanianKenyanKiowaKoreanLaotianLatvianLebaneseLiberianLithuanianLumbeeLuxembourgerMacedonianMalaysianMalteseMarshalleseMenomineeMexicanMexican American IndianMongolianMoroccanNative HawaiianNavajoNepaleseNew ZealanderNicaraguanNigerianNorthern EuropeanNorwegianOkinawanOsageOttawaPaiutePakistaniPalestinianPanamanianParaguayanPennsylvania GermanPeruvianPimaPolishPortuguesePotawatomiPuebloPuerto RicanPuget Sound SalishRomanianRussianSalvadoranSamoanScandinavianScotch-IrishScottishSeminoleSenegaleseSerbianShoshoneSierra LeoneanSiouxSlavicSlovakSloveneSomaliSouth AfricanSouth AmericanSouth American IndianSoviet UnionSpaniardSpanishSpanish AmericanSpanish American IndianSri LankanSubsaharan AfricanSudaneseSwedishSwissSyrianTaiwaneseThaiTlingit-HaidaTohono O'OdhamTonganTrinidadian and TobagonianTsimshianTurkishU.S. Virgin IslanderUgandanUkrainianUruguayanUteVenezuelanWelshWest IndianYakamaYaquiYugoslavianYumanYup'ikZimbabwean
Immigration
NonimmigrantsImmigrantsAfghanistanAfricaAlbaniaArgentinaArmeniaAsiaAustraliaAustriaBahamasBangladeshBarbadosBelarusBelgiumBelizeBoliviaBosnia and HerzegovinaBrazilBulgariaBurma/MyanmarCabo VerdeCambodiaCameroonCanadaCaribbeanCentral AmericaChileChinaColombiaCongoCosta RicaCroatiaCubaCzechoslovakiaDenmarkDominicaDominican RepublicEastern AfricaEastern AsiaEastern EuropeEcuadorEgyptEl SalvadorEnglandEritreaEthiopiaEuropeFijiFranceGermanyGhanaGreeceGrenadaGuatemalaGuyanaHaitiHondurasHong KongHungaryIndiaIndonesiaIranIraqIrelandIsraelItalyJamaicaJapanJordanKazakhstanKenyaKoreaKuwaitLaosLatin AmericaLatviaLebanonLiberiaLithuaniaMalaysiaMexicoMicronesiaMiddle AfricaMoldovaMoroccoNepalNetherlandsNicaraguaNigeriaNorth AmericaNorth MacedoniaNorthern AfricaNorthern EuropeNorwayOceaniaPakistanPanamaPeruPhilippinesPolandPortugalRomaniaRussiaSaudi ArabiaScotlandSenegalSerbiaSierra LeoneSingaporeSomaliaSouth AfricaSouth AmericaSouth Central AsiaSouth Eastern AsiaSouthern EuropeSpainSri LankaSt. Vincent and the GrenadinesSudanSwedenSwitzerlandSyriaTaiwanThailandTrinidad and TobagoTurkeyUgandaUkraineUruguayUzbekistanVenezuelaVietnamWest IndiesWestern AfricaWestern AsiaWestern EuropeYemenZaireZimbabweAzores
Unemployment Among Youth under 25 years
Income
Poverty
Unemployment
Labor Participation
Family Structure
Vehicle Availability
Education Level
Disability

Unemployment Among Youth under 25 years Comparison

Vietnamese

Comanche

Tragic
Poor
14.3%
UNEMPLOYMENT AMONG YOUTH UNDER 25 YEARS
0.0/ 100
METRIC RATING
312th/ 347
METRIC RANK
11.8%
UNEMPLOYMENT AMONG YOUTH UNDER 25 YEARS
12.1/ 100
METRIC RATING
208th/ 347
METRIC RANK

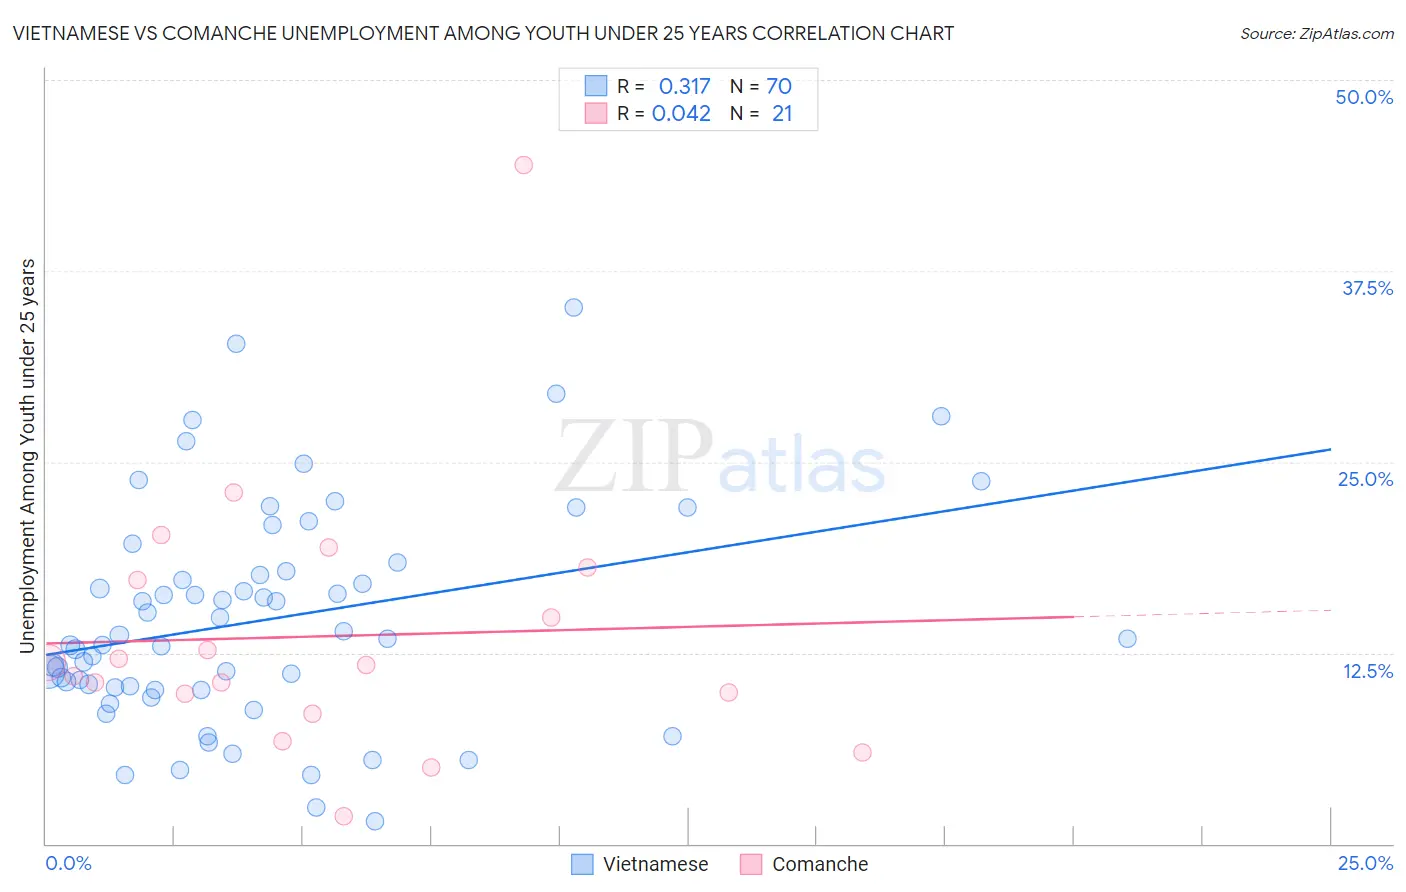
Vietnamese vs Comanche Unemployment Among Youth under 25 years Correlation Chart

The statistical analysis conducted on geographies consisting of 170,235,906 people shows a mild positive correlation between the proportion of Vietnamese and unemployment rate among youth under the age of 25 in the United States with a correlation coefficient (R) of 0.317 and weighted average of 14.3%. Similarly, the statistical analysis conducted on geographies consisting of 109,118,325 people shows no correlation between the proportion of Comanche and unemployment rate among youth under the age of 25 in the United States with a correlation coefficient (R) of 0.042 and weighted average of 11.8%, a difference of 20.4%.
Vietnamese vs Comanche Unemployment Among Youth under 25 years

Unemployment Among Youth under 25 years Correlation Summary

MeasurementVietnameseComanche
Minimum1.5%1.8%
Maximum35.1%44.4%
Range33.6%42.6%
Mean14.7%13.6%
Median13.4%11.7%
Interquartile 25% (IQ1)10.2%9.2%
Interquartile 75% (IQ3)17.8%17.7%
Interquartile Range (IQR)7.6%8.5%
Standard Deviation (Sample)7.1%8.8%
Standard Deviation (Population)7.1%8.6%

Similar Demographics by Unemployment Among Youth under 25 years

Demographics Similar to Vietnamese by Unemployment Among Youth under 25 years

In terms of unemployment among youth under 25 years, the demographic groups most similar to Vietnamese are Immigrants from Bangladesh (14.2%, a difference of 0.31%), Immigrants from West Indies (14.2%, a difference of 0.34%), Immigrants from Armenia (14.4%, a difference of 0.83%), Aleut (14.1%, a difference of 0.89%), and Jamaican (14.4%, a difference of 0.92%).
DemographicsRating | RankUnemployment Among Youth under 25 years
Haitians
0.0
/100
|
#305
Tragic
13.9%
Pueblo
0.0
/100
|
#306
Tragic
13.9%
Immigrants | Haiti
0.0
/100
|
#307
Tragic
14.0%
Immigrants | Belize
0.0
/100
|
#308
Tragic
14.0%
Aleuts
0.0
/100
|
#309
Tragic
14.1%
Immigrants | West Indies
0.0
/100
|
#310
Tragic
14.2%
Immigrants | Bangladesh
0.0
/100
|
#311
Tragic
14.2%
Vietnamese
0.0
/100
|
#312
Tragic
14.3%
Immigrants | Armenia
0.0
/100
|
#313
Tragic
14.4%
Jamaicans
0.0
/100
|
#314
Tragic
14.4%
Sioux
0.0
/100
|
#315
Tragic
14.4%
Natives/Alaskans
0.0
/100
|
#316
Tragic
14.5%
Blacks/African Americans
0.0
/100
|
#317
Tragic
14.5%
Immigrants | Dominica
0.0
/100
|
#318
Tragic
14.6%
West Indians
0.0
/100
|
#319
Tragic
14.6%

Demographics Similar to Comanche by Unemployment Among Youth under 25 years

In terms of unemployment among youth under 25 years, the demographic groups most similar to Comanche are Immigrants from Southern Europe (11.8%, a difference of 0.020%), Immigrants from Pakistan (11.8%, a difference of 0.040%), Immigrants from Lebanon (11.8%, a difference of 0.080%), Peruvian (11.8%, a difference of 0.17%), and Assyrian/Chaldean/Syriac (11.9%, a difference of 0.23%).
DemographicsRating | RankUnemployment Among Youth under 25 years
Palestinians
16.0
/100
|
#201
Poor
11.8%
Marshallese
15.8
/100
|
#202
Poor
11.8%
Immigrants | Peru
15.3
/100
|
#203
Poor
11.8%
Immigrants | Costa Rica
15.2
/100
|
#204
Poor
11.8%
Peruvians
14.0
/100
|
#205
Poor
11.8%
Immigrants | Pakistan
12.6
/100
|
#206
Poor
11.8%
Immigrants | Southern Europe
12.3
/100
|
#207
Poor
11.8%
Comanche
12.1
/100
|
#208
Poor
11.8%
Immigrants | Lebanon
11.3
/100
|
#209
Poor
11.8%
Assyrians/Chaldeans/Syriacs
9.8
/100
|
#210
Tragic
11.9%
Immigrants | Philippines
9.2
/100
|
#211
Tragic
11.9%
Colombians
9.1
/100
|
#212
Tragic
11.9%
South Americans
8.5
/100
|
#213
Tragic
11.9%
Costa Ricans
8.2
/100
|
#214
Tragic
11.9%
Samoans
7.4
/100
|
#215
Tragic
11.9%