Venezuelan vs Immigrants from Uzbekistan Unemployment Among Ages 25 to 29 years
COMPARE
Venezuelan
Immigrants from Uzbekistan
Unemployment Among Ages 25 to 29 years
Unemployment Among Ages 25 to 29 years Comparison
Venezuelans
Immigrants from Uzbekistan
6.2%
UNEMPLOYMENT AMONG AGES 25 TO 29 YEARS
99.1/ 100
METRIC RATING
45th/ 347
METRIC RANK
7.2%
UNEMPLOYMENT AMONG AGES 25 TO 29 YEARS
0.7/ 100
METRIC RATING
246th/ 347
METRIC RANK
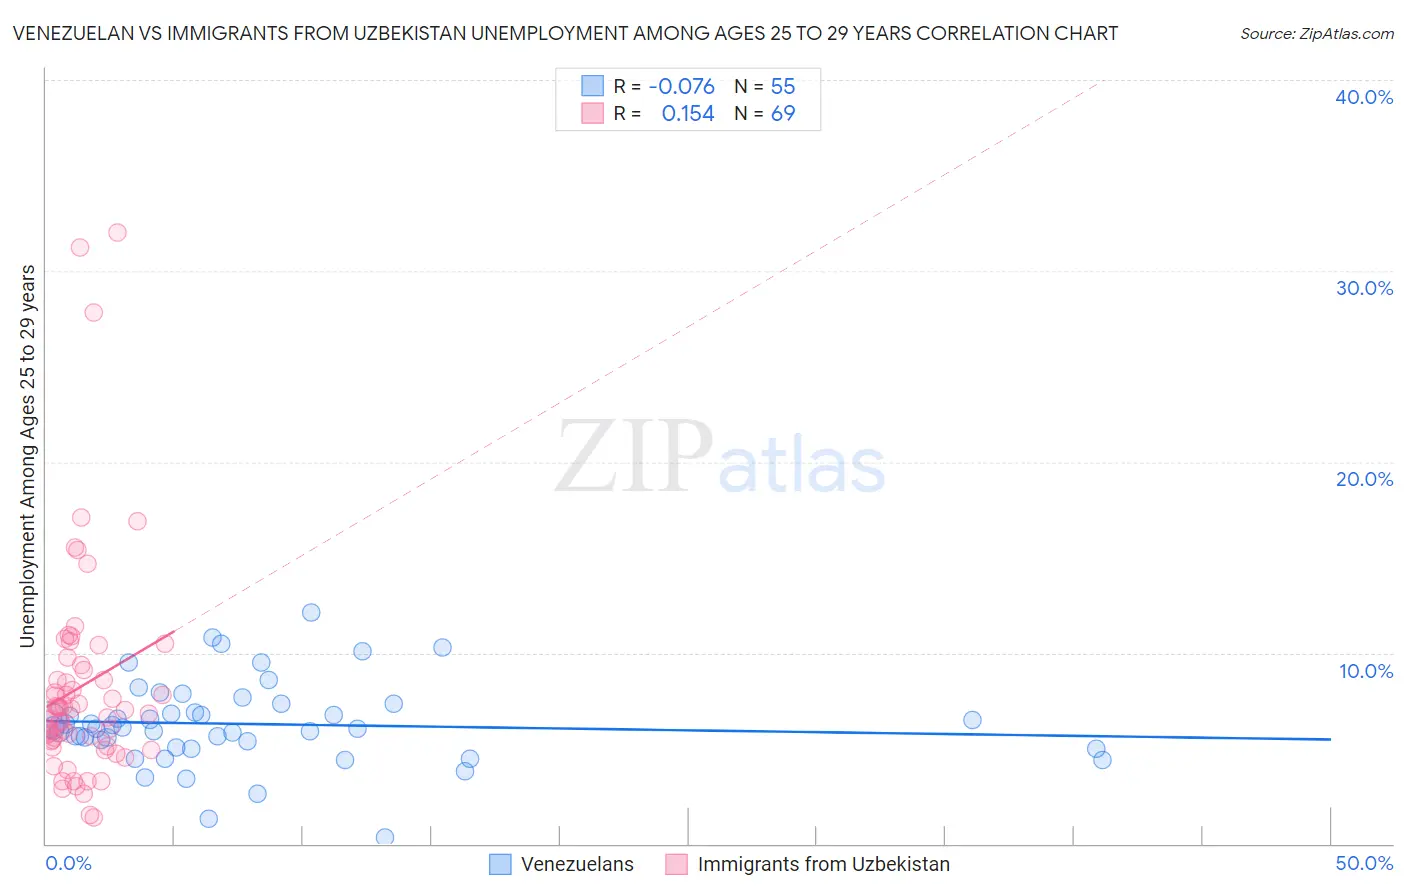
Venezuelan vs Immigrants from Uzbekistan Unemployment Among Ages 25 to 29 years Correlation Chart
The statistical analysis conducted on geographies consisting of 296,350,237 people shows a slight negative correlation between the proportion of Venezuelans and unemployment rate among population between the ages 25 and 29 in the United States with a correlation coefficient (R) of -0.076 and weighted average of 6.2%. Similarly, the statistical analysis conducted on geographies consisting of 116,752,358 people shows a poor positive correlation between the proportion of Immigrants from Uzbekistan and unemployment rate among population between the ages 25 and 29 in the United States with a correlation coefficient (R) of 0.154 and weighted average of 7.2%, a difference of 16.0%.
Unemployment Among Ages 25 to 29 years Correlation Summary
| Measurement | Venezuelan | Immigrants from Uzbekistan |
| Minimum | 0.30% | 1.4% |
| Maximum | 12.1% | 32.0% |
| Range | 11.8% | 30.6% |
| Mean | 6.3% | 8.2% |
| Median | 6.1% | 7.0% |
| Interquartile 25% (IQ1) | 5.1% | 5.2% |
| Interquartile 75% (IQ3) | 7.3% | 9.2% |
| Interquartile Range (IQR) | 2.2% | 4.0% |
| Standard Deviation (Sample) | 2.2% | 5.8% |
| Standard Deviation (Population) | 2.2% | 5.8% |
Similar Demographics by Unemployment Among Ages 25 to 29 years
Demographics Similar to Venezuelans by Unemployment Among Ages 25 to 29 years
In terms of unemployment among ages 25 to 29 years, the demographic groups most similar to Venezuelans are Immigrants from Lithuania (6.2%, a difference of 0.080%), Latvian (6.2%, a difference of 0.10%), Immigrants from Australia (6.2%, a difference of 0.11%), German Russian (6.2%, a difference of 0.18%), and Mongolian (6.2%, a difference of 0.20%).
| Demographics | Rating | Rank | Unemployment Among Ages 25 to 29 years |
| Ethiopians | 99.4 /100 | #38 | Exceptional 6.1% |
| Indonesians | 99.3 /100 | #39 | Exceptional 6.1% |
| Immigrants | Kenya | 99.3 /100 | #40 | Exceptional 6.1% |
| Fijians | 99.3 /100 | #41 | Exceptional 6.1% |
| Jordanians | 99.3 /100 | #42 | Exceptional 6.1% |
| Czechs | 99.2 /100 | #43 | Exceptional 6.2% |
| Mongolians | 99.2 /100 | #44 | Exceptional 6.2% |
| Venezuelans | 99.1 /100 | #45 | Exceptional 6.2% |
| Immigrants | Lithuania | 99.0 /100 | #46 | Exceptional 6.2% |
| Latvians | 99.0 /100 | #47 | Exceptional 6.2% |
| Immigrants | Australia | 99.0 /100 | #48 | Exceptional 6.2% |
| German Russians | 99.0 /100 | #49 | Exceptional 6.2% |
| Soviet Union | 98.9 /100 | #50 | Exceptional 6.2% |
| Burmese | 98.9 /100 | #51 | Exceptional 6.2% |
| Immigrants | Turkey | 98.9 /100 | #52 | Exceptional 6.2% |
Demographics Similar to Immigrants from Uzbekistan by Unemployment Among Ages 25 to 29 years
In terms of unemployment among ages 25 to 29 years, the demographic groups most similar to Immigrants from Uzbekistan are Immigrants from Guatemala (7.2%, a difference of 0.010%), Subsaharan African (7.2%, a difference of 0.18%), Seminole (7.2%, a difference of 0.20%), Delaware (7.2%, a difference of 0.37%), and Guatemalan (7.1%, a difference of 0.40%).
| Demographics | Rating | Rank | Unemployment Among Ages 25 to 29 years |
| Potawatomi | 1.3 /100 | #239 | Tragic 7.1% |
| Native Hawaiians | 1.3 /100 | #240 | Tragic 7.1% |
| Immigrants | Sierra Leone | 1.3 /100 | #241 | Tragic 7.1% |
| Spanish American Indians | 1.1 /100 | #242 | Tragic 7.1% |
| Yaqui | 1.0 /100 | #243 | Tragic 7.1% |
| Immigrants | Nonimmigrants | 0.9 /100 | #244 | Tragic 7.1% |
| Guatemalans | 0.9 /100 | #245 | Tragic 7.1% |
| Immigrants | Uzbekistan | 0.7 /100 | #246 | Tragic 7.2% |
| Immigrants | Guatemala | 0.7 /100 | #247 | Tragic 7.2% |
| Sub-Saharan Africans | 0.6 /100 | #248 | Tragic 7.2% |
| Seminole | 0.6 /100 | #249 | Tragic 7.2% |
| Delaware | 0.5 /100 | #250 | Tragic 7.2% |
| Portuguese | 0.5 /100 | #251 | Tragic 7.2% |
| Sierra Leoneans | 0.4 /100 | #252 | Tragic 7.2% |
| Immigrants | Portugal | 0.3 /100 | #253 | Tragic 7.2% |