Ute vs Trinidadian and Tobagonian Unemployment Among Women with Children Under 18 years
COMPARE
Ute
Trinidadian and Tobagonian
Unemployment Among Women with Children Under 18 years
Unemployment Among Women with Children Under 18 years Comparison
Ute
Trinidadians and Tobagonians
5.9%
UNEMPLOYMENT AMONG WOMEN WITH CHILDREN UNDER 18 YEARS
0.7/ 100
METRIC RATING
251st/ 347
METRIC RANK
6.2%
UNEMPLOYMENT AMONG WOMEN WITH CHILDREN UNDER 18 YEARS
0.1/ 100
METRIC RATING
268th/ 347
METRIC RANK
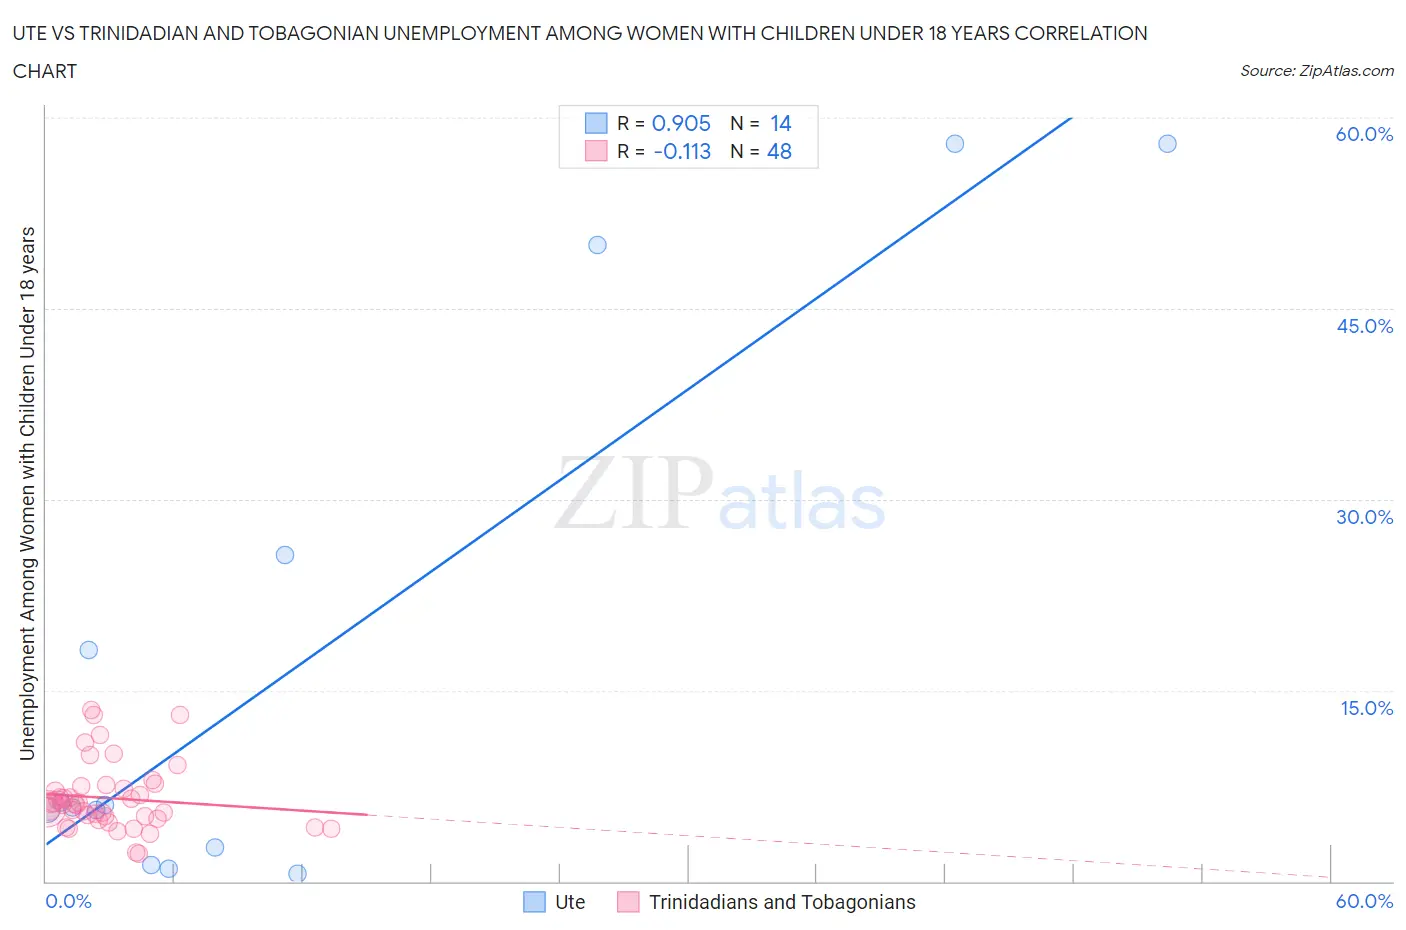
Ute vs Trinidadian and Tobagonian Unemployment Among Women with Children Under 18 years Correlation Chart
The statistical analysis conducted on geographies consisting of 55,040,080 people shows a near-perfect positive correlation between the proportion of Ute and unemployment rate among women with children under the age of 18 in the United States with a correlation coefficient (R) of 0.905 and weighted average of 5.9%. Similarly, the statistical analysis conducted on geographies consisting of 215,866,912 people shows a poor negative correlation between the proportion of Trinidadians and Tobagonians and unemployment rate among women with children under the age of 18 in the United States with a correlation coefficient (R) of -0.113 and weighted average of 6.2%, a difference of 4.3%.
Unemployment Among Women with Children Under 18 years Correlation Summary
| Measurement | Ute | Trinidadian and Tobagonian |
| Minimum | 0.60% | 2.2% |
| Maximum | 57.9% | 13.4% |
| Range | 57.3% | 11.2% |
| Mean | 17.5% | 6.5% |
| Median | 5.9% | 6.0% |
| Interquartile 25% (IQ1) | 2.7% | 5.0% |
| Interquartile 75% (IQ3) | 25.6% | 7.4% |
| Interquartile Range (IQR) | 22.9% | 2.4% |
| Standard Deviation (Sample) | 21.7% | 2.6% |
| Standard Deviation (Population) | 20.9% | 2.6% |
Demographics Similar to Ute and Trinidadians and Tobagonians by Unemployment Among Women with Children Under 18 years
In terms of unemployment among women with children under 18 years, the demographic groups most similar to Ute are Immigrants from Cabo Verde (5.9%, a difference of 0.010%), Immigrants from Cameroon (5.9%, a difference of 0.080%), Seminole (6.0%, a difference of 0.62%), Immigrants from Congo (6.0%, a difference of 0.84%), and Immigrants from the Azores (6.0%, a difference of 1.6%). Similarly, the demographic groups most similar to Trinidadians and Tobagonians are French American Indian (6.2%, a difference of 0.010%), Subsaharan African (6.2%, a difference of 0.030%), Cajun (6.2%, a difference of 0.040%), Immigrants from Bahamas (6.1%, a difference of 0.36%), and Comanche (6.1%, a difference of 0.52%).
| Demographics | Rating | Rank | Unemployment Among Women with Children Under 18 years |
| Immigrants | Cameroon | 0.8 /100 | #249 | Tragic 5.9% |
| Immigrants | Cabo Verde | 0.7 /100 | #250 | Tragic 5.9% |
| Ute | 0.7 /100 | #251 | Tragic 5.9% |
| Seminole | 0.5 /100 | #252 | Tragic 6.0% |
| Immigrants | Congo | 0.4 /100 | #253 | Tragic 6.0% |
| Immigrants | Azores | 0.3 /100 | #254 | Tragic 6.0% |
| Liberians | 0.2 /100 | #255 | Tragic 6.0% |
| Nepalese | 0.2 /100 | #256 | Tragic 6.0% |
| Bermudans | 0.1 /100 | #257 | Tragic 6.1% |
| Immigrants | Nigeria | 0.1 /100 | #258 | Tragic 6.1% |
| Ottawa | 0.1 /100 | #259 | Tragic 6.1% |
| Nigerians | 0.1 /100 | #260 | Tragic 6.1% |
| Immigrants | Liberia | 0.1 /100 | #261 | Tragic 6.1% |
| Immigrants | Trinidad and Tobago | 0.1 /100 | #262 | Tragic 6.1% |
| Spanish American Indians | 0.1 /100 | #263 | Tragic 6.1% |
| Comanche | 0.1 /100 | #264 | Tragic 6.1% |
| Immigrants | Bahamas | 0.1 /100 | #265 | Tragic 6.1% |
| Sub-Saharan Africans | 0.1 /100 | #266 | Tragic 6.2% |
| French American Indians | 0.1 /100 | #267 | Tragic 6.2% |
| Trinidadians and Tobagonians | 0.1 /100 | #268 | Tragic 6.2% |
| Cajuns | 0.1 /100 | #269 | Tragic 6.2% |