Ute vs Paraguayan Unemployment Among Ages 45 to 54 years
COMPARE
Ute
Paraguayan
Unemployment Among Ages 45 to 54 years
Unemployment Among Ages 45 to 54 years Comparison
Ute
Paraguayans
6.2%
UNEMPLOYMENT AMONG AGES 45 TO 54 YEARS
0.0/ 100
METRIC RATING
326th/ 347
METRIC RANK
4.3%
UNEMPLOYMENT AMONG AGES 45 TO 54 YEARS
98.6/ 100
METRIC RATING
70th/ 347
METRIC RANK
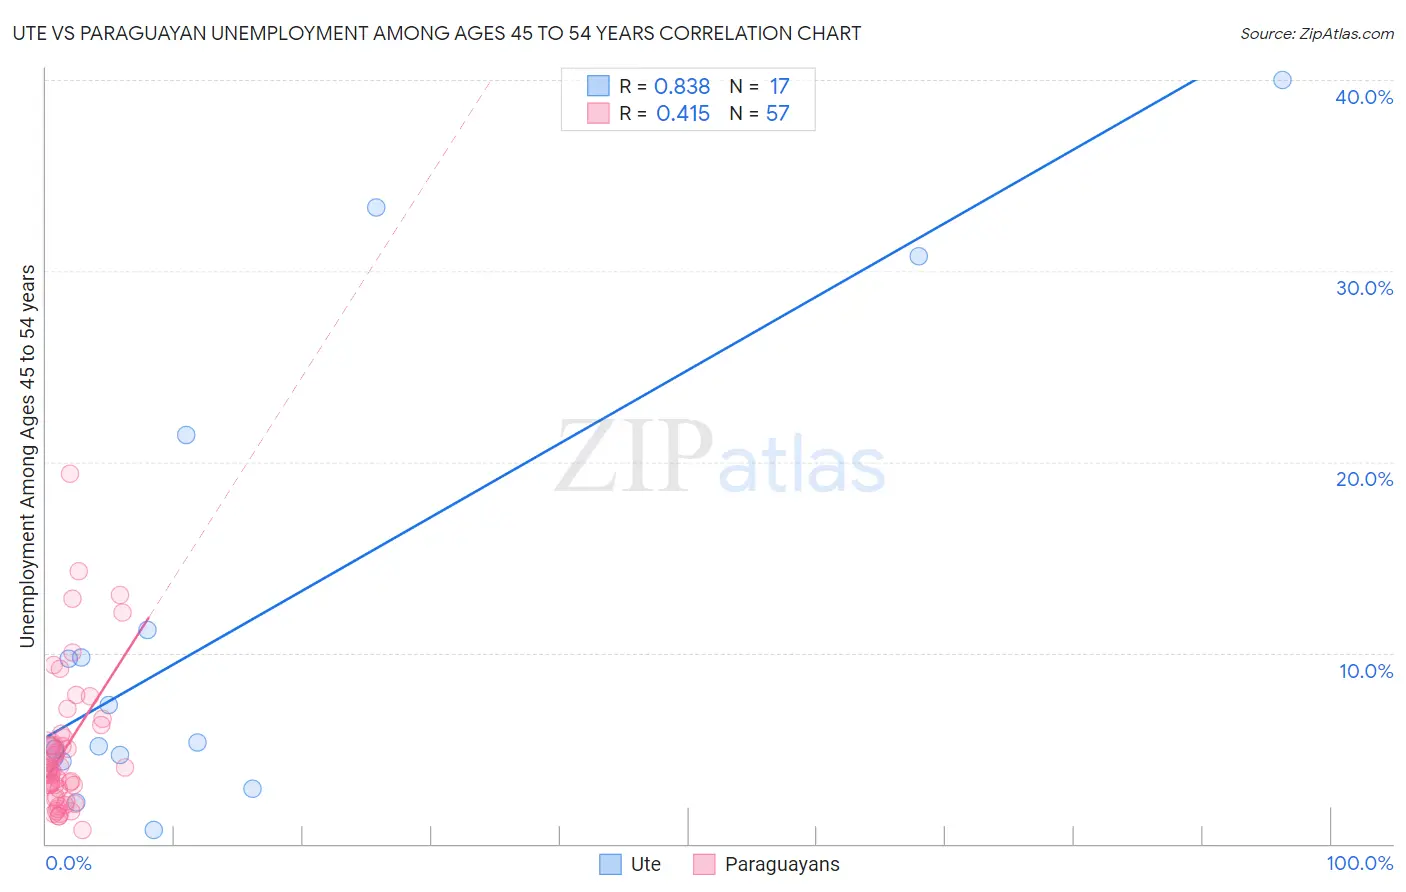
Ute vs Paraguayan Unemployment Among Ages 45 to 54 years Correlation Chart
The statistical analysis conducted on geographies consisting of 55,276,716 people shows a very strong positive correlation between the proportion of Ute and unemployment rate among population between the ages 45 and 54 in the United States with a correlation coefficient (R) of 0.838 and weighted average of 6.2%. Similarly, the statistical analysis conducted on geographies consisting of 94,646,990 people shows a moderate positive correlation between the proportion of Paraguayans and unemployment rate among population between the ages 45 and 54 in the United States with a correlation coefficient (R) of 0.415 and weighted average of 4.3%, a difference of 44.0%.
Unemployment Among Ages 45 to 54 years Correlation Summary
| Measurement | Ute | Paraguayan |
| Minimum | 0.70% | 0.70% |
| Maximum | 40.0% | 19.4% |
| Range | 39.3% | 18.7% |
| Mean | 11.7% | 4.9% |
| Median | 5.3% | 3.9% |
| Interquartile 25% (IQ1) | 4.5% | 2.7% |
| Interquartile 75% (IQ3) | 16.3% | 5.7% |
| Interquartile Range (IQR) | 11.8% | 3.0% |
| Standard Deviation (Sample) | 12.1% | 3.7% |
| Standard Deviation (Population) | 11.7% | 3.6% |
Similar Demographics by Unemployment Among Ages 45 to 54 years
Demographics Similar to Ute by Unemployment Among Ages 45 to 54 years
In terms of unemployment among ages 45 to 54 years, the demographic groups most similar to Ute are Dominican (6.2%, a difference of 0.21%), Pueblo (6.2%, a difference of 0.42%), Immigrants from Armenia (6.1%, a difference of 0.84%), Alaska Native (6.3%, a difference of 1.1%), and Immigrants from Dominican Republic (6.3%, a difference of 1.3%).
| Demographics | Rating | Rank | Unemployment Among Ages 45 to 54 years |
| Cape Verdeans | 0.0 /100 | #319 | Tragic 5.7% |
| Immigrants | St. Vincent and the Grenadines | 0.0 /100 | #320 | Tragic 5.7% |
| Yakama | 0.0 /100 | #321 | Tragic 5.7% |
| Immigrants | Azores | 0.0 /100 | #322 | Tragic 5.7% |
| Immigrants | Cabo Verde | 0.0 /100 | #323 | Tragic 5.9% |
| Natives/Alaskans | 0.0 /100 | #324 | Tragic 6.1% |
| Immigrants | Armenia | 0.0 /100 | #325 | Tragic 6.1% |
| Ute | 0.0 /100 | #326 | Tragic 6.2% |
| Dominicans | 0.0 /100 | #327 | Tragic 6.2% |
| Pueblo | 0.0 /100 | #328 | Tragic 6.2% |
| Alaska Natives | 0.0 /100 | #329 | Tragic 6.3% |
| Immigrants | Dominican Republic | 0.0 /100 | #330 | Tragic 6.3% |
| Tohono O'odham | 0.0 /100 | #331 | Tragic 6.3% |
| Pima | 0.0 /100 | #332 | Tragic 6.4% |
| Immigrants | Yemen | 0.0 /100 | #333 | Tragic 6.5% |
Demographics Similar to Paraguayans by Unemployment Among Ages 45 to 54 years
In terms of unemployment among ages 45 to 54 years, the demographic groups most similar to Paraguayans are Palestinian (4.3%, a difference of 0.080%), White/Caucasian (4.3%, a difference of 0.11%), Immigrants from Japan (4.3%, a difference of 0.14%), Slovak (4.3%, a difference of 0.27%), and Canadian (4.3%, a difference of 0.28%).
| Demographics | Rating | Rank | Unemployment Among Ages 45 to 54 years |
| Pennsylvania Germans | 99.1 /100 | #63 | Exceptional 4.3% |
| Austrians | 99.0 /100 | #64 | Exceptional 4.3% |
| Immigrants | Sudan | 99.0 /100 | #65 | Exceptional 4.3% |
| Turks | 98.9 /100 | #66 | Exceptional 4.3% |
| Immigrants | Nepal | 98.9 /100 | #67 | Exceptional 4.3% |
| Slovaks | 98.8 /100 | #68 | Exceptional 4.3% |
| Immigrants | Japan | 98.7 /100 | #69 | Exceptional 4.3% |
| Paraguayans | 98.6 /100 | #70 | Exceptional 4.3% |
| Palestinians | 98.5 /100 | #71 | Exceptional 4.3% |
| Whites/Caucasians | 98.4 /100 | #72 | Exceptional 4.3% |
| Canadians | 98.2 /100 | #73 | Exceptional 4.3% |
| Immigrants | Belgium | 98.2 /100 | #74 | Exceptional 4.3% |
| Kenyans | 98.1 /100 | #75 | Exceptional 4.3% |
| Slavs | 98.1 /100 | #76 | Exceptional 4.3% |
| Chileans | 98.1 /100 | #77 | Exceptional 4.3% |