Ute vs Ghanaian Male Unemployment
COMPARE
Ute
Ghanaian
Male Unemployment
Male Unemployment Comparison
Ute
Ghanaians
6.6%
MALE UNEMPLOYMENT
0.0/ 100
METRIC RATING
302nd/ 347
METRIC RANK
6.1%
MALE UNEMPLOYMENT
0.0/ 100
METRIC RATING
279th/ 347
METRIC RANK
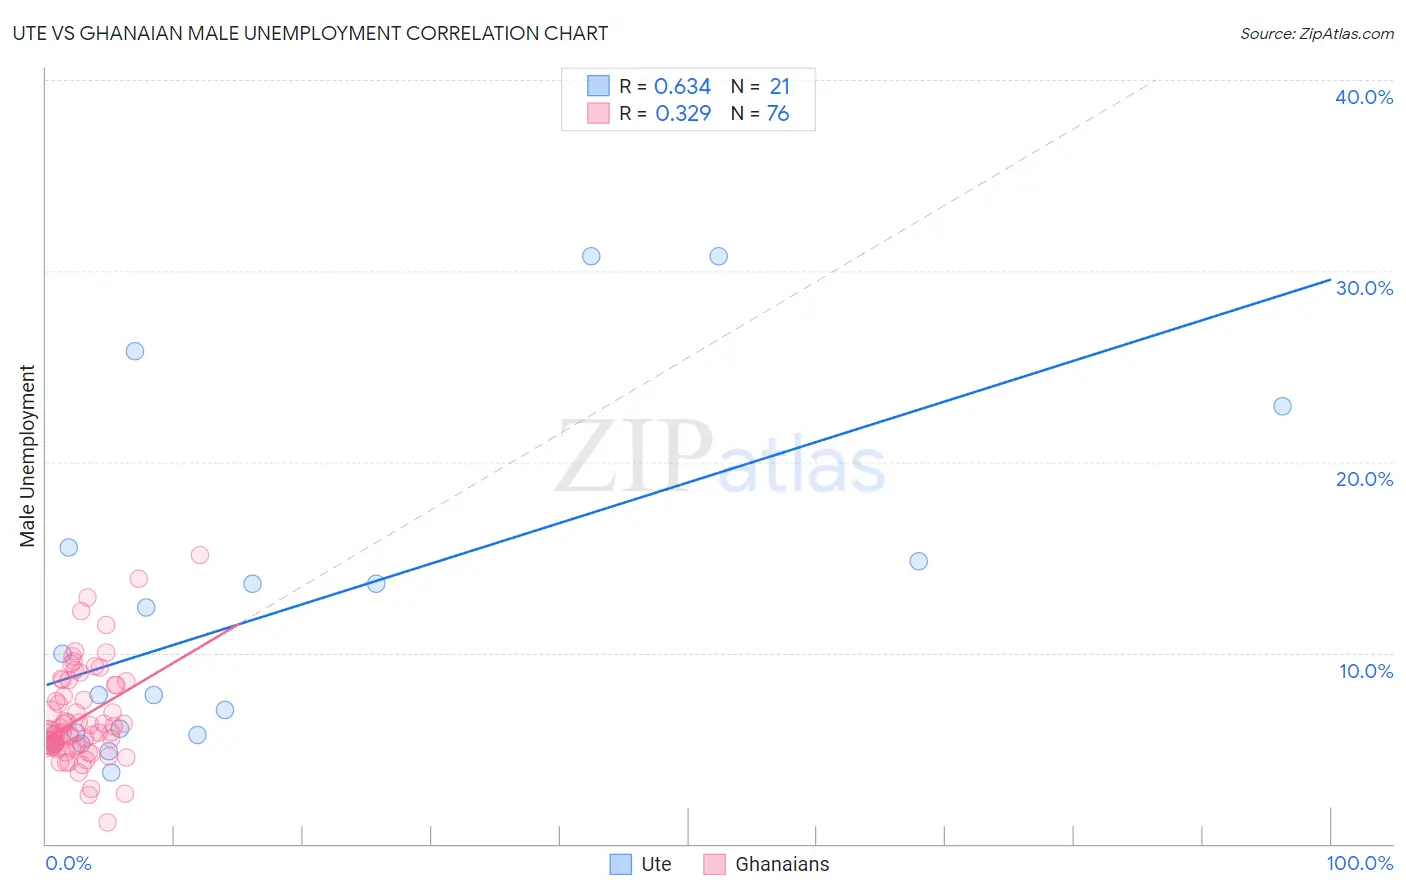
Ute vs Ghanaian Male Unemployment Correlation Chart
The statistical analysis conducted on geographies consisting of 55,563,809 people shows a significant positive correlation between the proportion of Ute and unemployment rate among males in the United States with a correlation coefficient (R) of 0.634 and weighted average of 6.6%. Similarly, the statistical analysis conducted on geographies consisting of 190,397,000 people shows a mild positive correlation between the proportion of Ghanaians and unemployment rate among males in the United States with a correlation coefficient (R) of 0.329 and weighted average of 6.1%, a difference of 8.9%.
Male Unemployment Correlation Summary
| Measurement | Ute | Ghanaian |
| Minimum | 3.7% | 1.1% |
| Maximum | 30.8% | 15.1% |
| Range | 27.1% | 14.0% |
| Mean | 12.1% | 6.6% |
| Median | 7.8% | 5.8% |
| Interquartile 25% (IQ1) | 5.6% | 5.1% |
| Interquartile 75% (IQ3) | 15.2% | 8.3% |
| Interquartile Range (IQR) | 9.6% | 3.2% |
| Standard Deviation (Sample) | 8.6% | 2.6% |
| Standard Deviation (Population) | 8.4% | 2.5% |
Similar Demographics by Male Unemployment
Demographics Similar to Ute by Male Unemployment
In terms of male unemployment, the demographic groups most similar to Ute are Immigrants from West Indies (6.7%, a difference of 0.36%), West Indian (6.7%, a difference of 0.37%), Trinidadian and Tobagonian (6.7%, a difference of 0.69%), Immigrants from Belize (6.6%, a difference of 0.71%), and Vietnamese (6.6%, a difference of 0.82%).
| Demographics | Rating | Rank | Male Unemployment |
| Belizeans | 0.0 /100 | #295 | Tragic 6.5% |
| Immigrants | Haiti | 0.0 /100 | #296 | Tragic 6.5% |
| Chippewa | 0.0 /100 | #297 | Tragic 6.6% |
| Jamaicans | 0.0 /100 | #298 | Tragic 6.6% |
| Immigrants | Bangladesh | 0.0 /100 | #299 | Tragic 6.6% |
| Vietnamese | 0.0 /100 | #300 | Tragic 6.6% |
| Immigrants | Belize | 0.0 /100 | #301 | Tragic 6.6% |
| Ute | 0.0 /100 | #302 | Tragic 6.6% |
| Immigrants | West Indies | 0.0 /100 | #303 | Tragic 6.7% |
| West Indians | 0.0 /100 | #304 | Tragic 6.7% |
| Trinidadians and Tobagonians | 0.0 /100 | #305 | Tragic 6.7% |
| Immigrants | Trinidad and Tobago | 0.0 /100 | #306 | Tragic 6.7% |
| Immigrants | Jamaica | 0.0 /100 | #307 | Tragic 6.7% |
| Aleuts | 0.0 /100 | #308 | Tragic 6.8% |
| Barbadians | 0.0 /100 | #309 | Tragic 6.9% |
Demographics Similar to Ghanaians by Male Unemployment
In terms of male unemployment, the demographic groups most similar to Ghanaians are Immigrants from Fiji (6.1%, a difference of 0.50%), Immigrants from Liberia (6.1%, a difference of 0.62%), Immigrants from Ghana (6.2%, a difference of 0.99%), Tlingit-Haida (6.0%, a difference of 1.1%), and Sierra Leonean (6.2%, a difference of 1.1%).
| Demographics | Rating | Rank | Male Unemployment |
| Immigrants | Uzbekistan | 0.0 /100 | #272 | Tragic 6.0% |
| Armenians | 0.0 /100 | #273 | Tragic 6.0% |
| Immigrants | Sierra Leone | 0.0 /100 | #274 | Tragic 6.0% |
| Menominee | 0.0 /100 | #275 | Tragic 6.0% |
| Tlingit-Haida | 0.0 /100 | #276 | Tragic 6.0% |
| Immigrants | Liberia | 0.0 /100 | #277 | Tragic 6.1% |
| Immigrants | Fiji | 0.0 /100 | #278 | Tragic 6.1% |
| Ghanaians | 0.0 /100 | #279 | Tragic 6.1% |
| Immigrants | Ghana | 0.0 /100 | #280 | Tragic 6.2% |
| Sierra Leoneans | 0.0 /100 | #281 | Tragic 6.2% |
| Ecuadorians | 0.0 /100 | #282 | Tragic 6.2% |
| Immigrants | Western Africa | 0.0 /100 | #283 | Tragic 6.2% |
| Spanish American Indians | 0.0 /100 | #284 | Tragic 6.2% |
| Immigrants | Ecuador | 0.0 /100 | #285 | Tragic 6.2% |
| Africans | 0.0 /100 | #286 | Tragic 6.3% |