Ute vs British Unemployment Among Ages 30 to 34 years
COMPARE
Ute
British
Unemployment Among Ages 30 to 34 years
Unemployment Among Ages 30 to 34 years Comparison
Ute
British
7.0%
UNEMPLOYMENT AMONG AGES 30 TO 34 YEARS
0.0/ 100
METRIC RATING
313th/ 347
METRIC RANK
5.3%
UNEMPLOYMENT AMONG AGES 30 TO 34 YEARS
89.1/ 100
METRIC RATING
101st/ 347
METRIC RANK
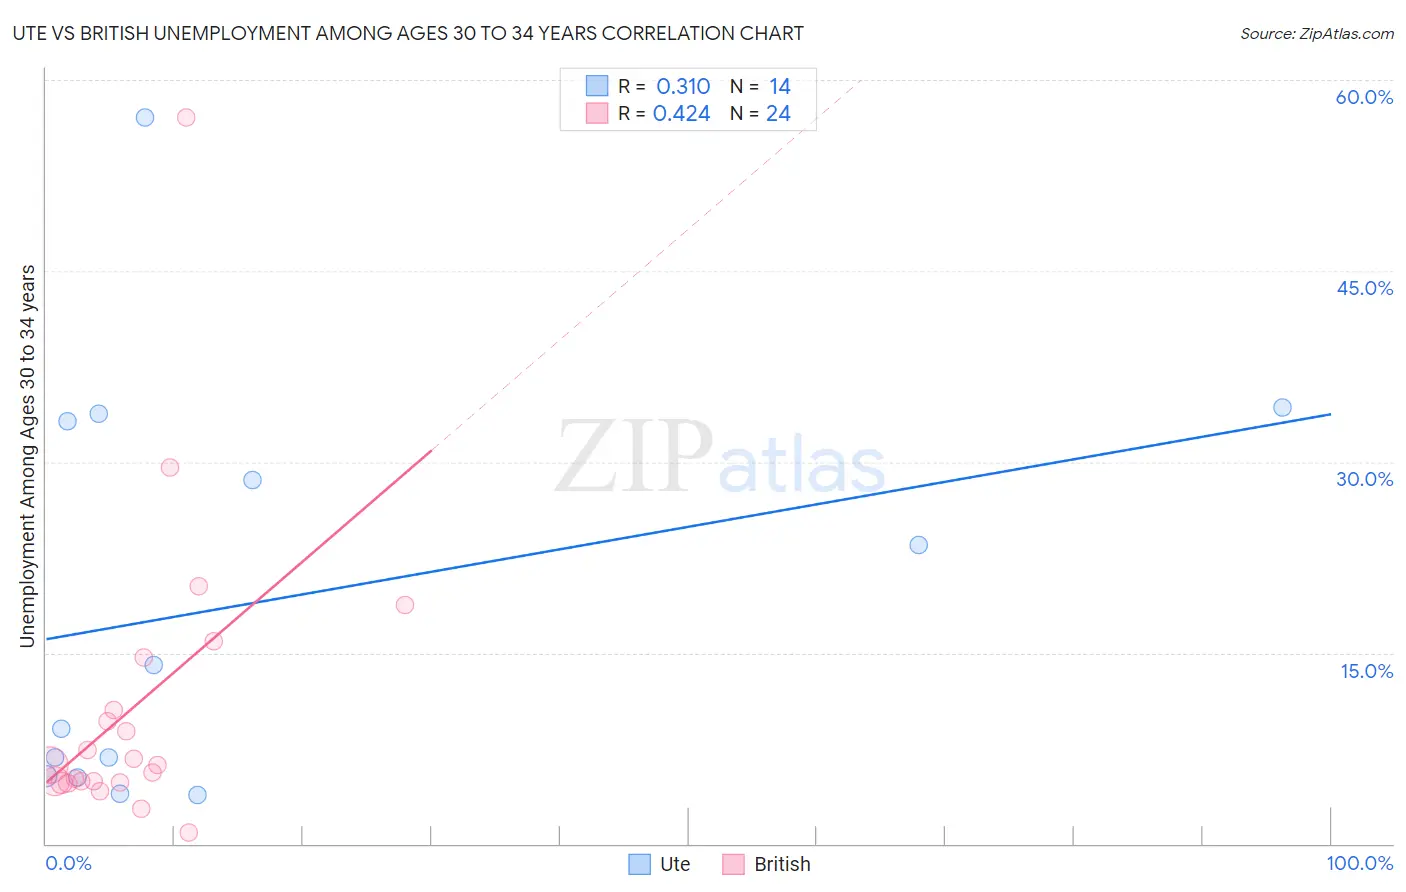
Ute vs British Unemployment Among Ages 30 to 34 years Correlation Chart
The statistical analysis conducted on geographies consisting of 54,847,910 people shows a mild positive correlation between the proportion of Ute and unemployment rate among population between the ages 30 and 34 in the United States with a correlation coefficient (R) of 0.310 and weighted average of 7.0%. Similarly, the statistical analysis conducted on geographies consisting of 474,684,741 people shows a moderate positive correlation between the proportion of British and unemployment rate among population between the ages 30 and 34 in the United States with a correlation coefficient (R) of 0.424 and weighted average of 5.3%, a difference of 33.9%.
Unemployment Among Ages 30 to 34 years Correlation Summary
| Measurement | Ute | British |
| Minimum | 3.8% | 0.90% |
| Maximum | 57.1% | 57.1% |
| Range | 53.3% | 56.2% |
| Mean | 19.0% | 10.8% |
| Median | 11.5% | 6.2% |
| Interquartile 25% (IQ1) | 5.3% | 4.8% |
| Interquartile 75% (IQ3) | 33.2% | 12.5% |
| Interquartile Range (IQR) | 27.9% | 7.7% |
| Standard Deviation (Sample) | 16.4% | 11.9% |
| Standard Deviation (Population) | 15.8% | 11.6% |
Similar Demographics by Unemployment Among Ages 30 to 34 years
Demographics Similar to Ute by Unemployment Among Ages 30 to 34 years
In terms of unemployment among ages 30 to 34 years, the demographic groups most similar to Ute are British West Indian (7.0%, a difference of 0.040%), Alaskan Athabascan (7.0%, a difference of 0.12%), Lumbee (7.1%, a difference of 0.21%), Aleut (7.1%, a difference of 0.58%), and Immigrants from St. Vincent and the Grenadines (7.0%, a difference of 1.2%).
| Demographics | Rating | Rank | Unemployment Among Ages 30 to 34 years |
| Immigrants | Armenia | 0.0 /100 | #306 | Tragic 6.8% |
| Immigrants | Belize | 0.0 /100 | #307 | Tragic 6.9% |
| Immigrants | Azores | 0.0 /100 | #308 | Tragic 6.9% |
| Immigrants | Grenada | 0.0 /100 | #309 | Tragic 6.9% |
| Immigrants | St. Vincent and the Grenadines | 0.0 /100 | #310 | Tragic 7.0% |
| Alaskan Athabascans | 0.0 /100 | #311 | Tragic 7.0% |
| British West Indians | 0.0 /100 | #312 | Tragic 7.0% |
| Ute | 0.0 /100 | #313 | Tragic 7.0% |
| Lumbee | 0.0 /100 | #314 | Tragic 7.1% |
| Aleuts | 0.0 /100 | #315 | Tragic 7.1% |
| Houma | 0.0 /100 | #316 | Tragic 7.2% |
| Immigrants | Cabo Verde | 0.0 /100 | #317 | Tragic 7.2% |
| Blacks/African Americans | 0.0 /100 | #318 | Tragic 7.2% |
| Guyanese | 0.0 /100 | #319 | Tragic 7.2% |
| Cape Verdeans | 0.0 /100 | #320 | Tragic 7.2% |
Demographics Similar to British by Unemployment Among Ages 30 to 34 years
In terms of unemployment among ages 30 to 34 years, the demographic groups most similar to British are Immigrants from Switzerland (5.3%, a difference of 0.060%), Immigrants from Jordan (5.3%, a difference of 0.070%), Immigrants from Czechoslovakia (5.3%, a difference of 0.080%), Northern European (5.3%, a difference of 0.23%), and Argentinean (5.3%, a difference of 0.23%).
| Demographics | Rating | Rank | Unemployment Among Ages 30 to 34 years |
| Maltese | 92.3 /100 | #94 | Exceptional 5.2% |
| Kenyans | 92.1 /100 | #95 | Exceptional 5.2% |
| Mongolians | 91.7 /100 | #96 | Exceptional 5.2% |
| Europeans | 91.7 /100 | #97 | Exceptional 5.2% |
| Immigrants | North Macedonia | 90.9 /100 | #98 | Exceptional 5.2% |
| Immigrants | Ireland | 90.6 /100 | #99 | Exceptional 5.2% |
| Immigrants | Czechoslovakia | 89.5 /100 | #100 | Excellent 5.3% |
| British | 89.1 /100 | #101 | Excellent 5.3% |
| Immigrants | Switzerland | 88.8 /100 | #102 | Excellent 5.3% |
| Immigrants | Jordan | 88.8 /100 | #103 | Excellent 5.3% |
| Northern Europeans | 87.9 /100 | #104 | Excellent 5.3% |
| Argentineans | 87.9 /100 | #105 | Excellent 5.3% |
| Croatians | 87.6 /100 | #106 | Excellent 5.3% |
| Icelanders | 87.2 /100 | #107 | Excellent 5.3% |
| Immigrants | Middle Africa | 87.1 /100 | #108 | Excellent 5.3% |