Uruguayan vs Immigrants from Burma/Myanmar Unemployment Among Seniors over 75 years
COMPARE
Uruguayan
Immigrants from Burma/Myanmar
Unemployment Among Seniors over 75 years
Unemployment Among Seniors over 75 years Comparison
Uruguayans
Immigrants from Burma/Myanmar
7.9%
UNEMPLOYMENT AMONG SENIORS OVER 75 YEARS
99.9/ 100
METRIC RATING
61st/ 347
METRIC RANK
7.7%
UNEMPLOYMENT AMONG SENIORS OVER 75 YEARS
100.0/ 100
METRIC RATING
41st/ 347
METRIC RANK
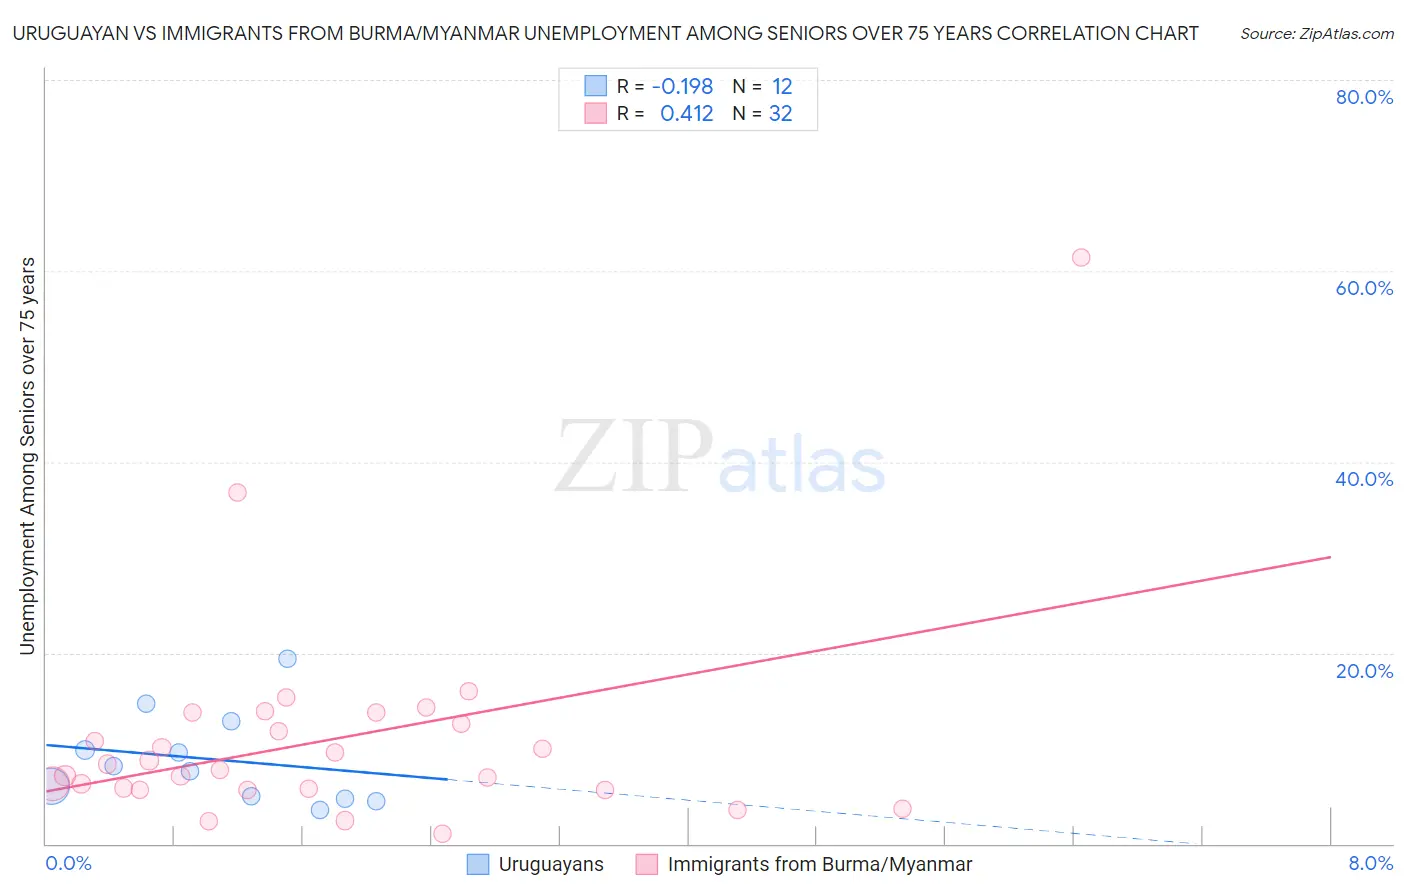
Uruguayan vs Immigrants from Burma/Myanmar Unemployment Among Seniors over 75 years Correlation Chart
The statistical analysis conducted on geographies consisting of 101,575,119 people shows a poor negative correlation between the proportion of Uruguayans and unemployment rate among seniors over the age of 75 in the United States with a correlation coefficient (R) of -0.198 and weighted average of 7.9%. Similarly, the statistical analysis conducted on geographies consisting of 114,707,279 people shows a moderate positive correlation between the proportion of Immigrants from Burma/Myanmar and unemployment rate among seniors over the age of 75 in the United States with a correlation coefficient (R) of 0.412 and weighted average of 7.7%, a difference of 2.6%.
Unemployment Among Seniors over 75 years Correlation Summary
| Measurement | Uruguayan | Immigrants from Burma/Myanmar |
| Minimum | 3.6% | 1.1% |
| Maximum | 19.4% | 61.4% |
| Range | 15.8% | 60.3% |
| Mean | 8.8% | 10.9% |
| Median | 7.9% | 8.1% |
| Interquartile 25% (IQ1) | 4.9% | 5.7% |
| Interquartile 75% (IQ3) | 11.4% | 13.2% |
| Interquartile Range (IQR) | 6.5% | 7.5% |
| Standard Deviation (Sample) | 4.8% | 11.2% |
| Standard Deviation (Population) | 4.6% | 11.0% |
Demographics Similar to Uruguayans and Immigrants from Burma/Myanmar by Unemployment Among Seniors over 75 years
In terms of unemployment among seniors over 75 years, the demographic groups most similar to Uruguayans are Immigrants from Morocco (7.9%, a difference of 0.040%), Indonesian (7.9%, a difference of 0.090%), Iranian (7.9%, a difference of 0.28%), Ottawa (7.9%, a difference of 0.33%), and Immigrants from Eastern Asia (7.9%, a difference of 0.51%). Similarly, the demographic groups most similar to Immigrants from Burma/Myanmar are Pueblo (7.7%, a difference of 0.23%), Immigrants from Denmark (7.8%, a difference of 0.53%), Immigrants from Spain (7.8%, a difference of 0.57%), British West Indian (7.8%, a difference of 0.58%), and Immigrants from China (7.8%, a difference of 0.64%).
| Demographics | Rating | Rank | Unemployment Among Seniors over 75 years |
| Immigrants | Burma/Myanmar | 100.0 /100 | #41 | Exceptional 7.7% |
| Pueblo | 100.0 /100 | #42 | Exceptional 7.7% |
| Immigrants | Denmark | 100.0 /100 | #43 | Exceptional 7.8% |
| Immigrants | Spain | 100.0 /100 | #44 | Exceptional 7.8% |
| British West Indians | 100.0 /100 | #45 | Exceptional 7.8% |
| Immigrants | China | 100.0 /100 | #46 | Exceptional 7.8% |
| Creek | 100.0 /100 | #47 | Exceptional 7.8% |
| Immigrants | Chile | 100.0 /100 | #48 | Exceptional 7.8% |
| Potawatomi | 100.0 /100 | #49 | Exceptional 7.8% |
| Immigrants | Latvia | 100.0 /100 | #50 | Exceptional 7.8% |
| Moroccans | 100.0 /100 | #51 | Exceptional 7.8% |
| Bahamians | 100.0 /100 | #52 | Exceptional 7.8% |
| Immigrants | Egypt | 100.0 /100 | #53 | Exceptional 7.9% |
| Immigrants | Malaysia | 99.9 /100 | #54 | Exceptional 7.9% |
| Filipinos | 99.9 /100 | #55 | Exceptional 7.9% |
| Immigrants | Eastern Asia | 99.9 /100 | #56 | Exceptional 7.9% |
| Ottawa | 99.9 /100 | #57 | Exceptional 7.9% |
| Iranians | 99.9 /100 | #58 | Exceptional 7.9% |
| Indonesians | 99.9 /100 | #59 | Exceptional 7.9% |
| Immigrants | Morocco | 99.9 /100 | #60 | Exceptional 7.9% |
| Uruguayans | 99.9 /100 | #61 | Exceptional 7.9% |