Ukrainian vs Delaware Unemployment Among Ages 65 to 74 years
COMPARE
Ukrainian
Delaware
Unemployment Among Ages 65 to 74 years
Unemployment Among Ages 65 to 74 years Comparison
Ukrainians
Delaware
5.3%
UNEMPLOYMENT AMONG AGES 65 TO 74 YEARS
82.0/ 100
METRIC RATING
133rd/ 347
METRIC RANK
6.0%
UNEMPLOYMENT AMONG AGES 65 TO 74 YEARS
0.0/ 100
METRIC RATING
323rd/ 347
METRIC RANK
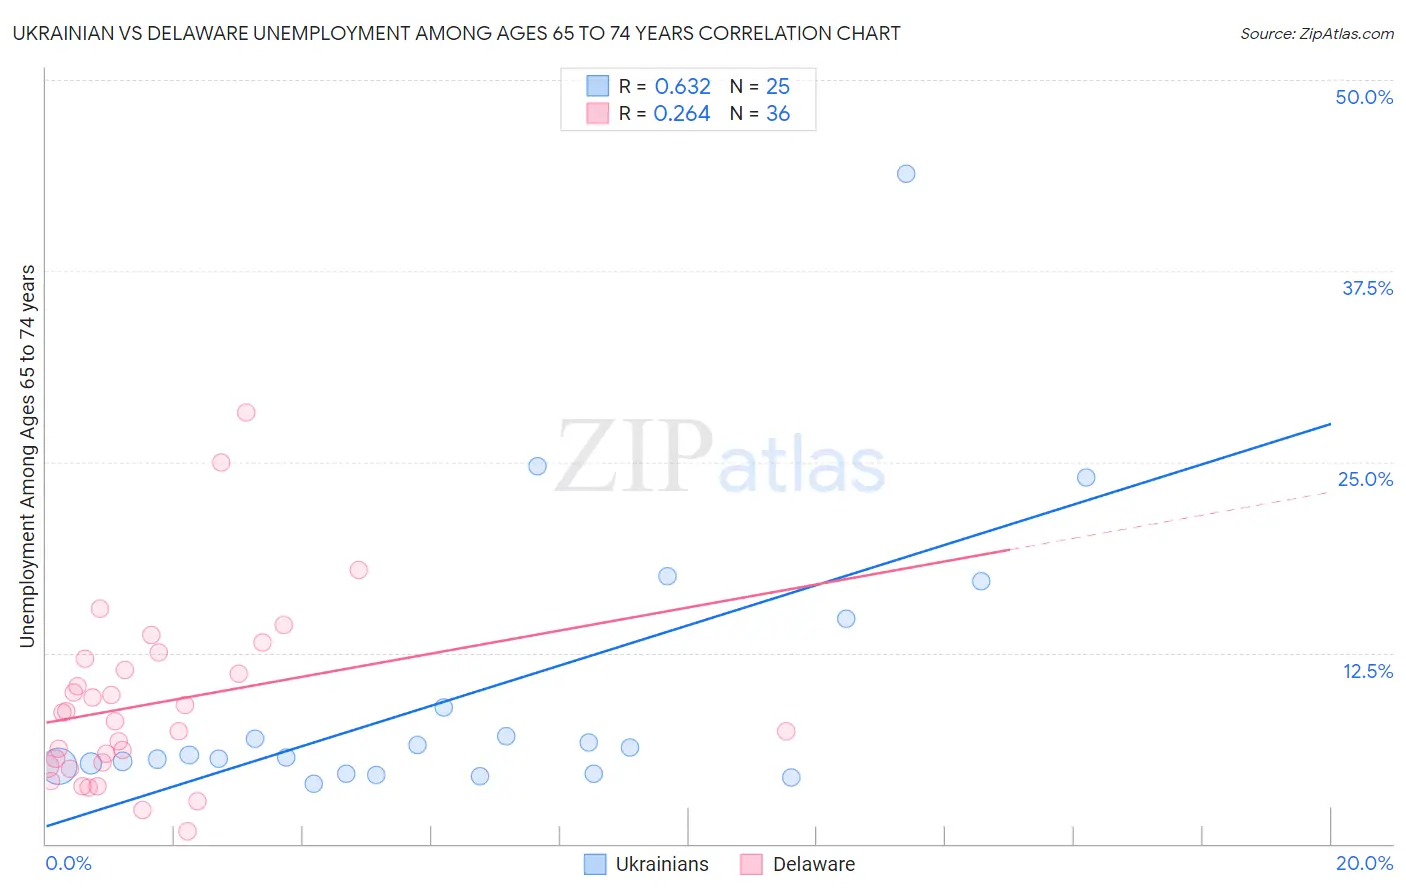
Ukrainian vs Delaware Unemployment Among Ages 65 to 74 years Correlation Chart
The statistical analysis conducted on geographies consisting of 382,809,126 people shows a significant positive correlation between the proportion of Ukrainians and unemployment rate among population between the ages 65 and 74 in the United States with a correlation coefficient (R) of 0.632 and weighted average of 5.3%. Similarly, the statistical analysis conducted on geographies consisting of 90,004,894 people shows a weak positive correlation between the proportion of Delaware and unemployment rate among population between the ages 65 and 74 in the United States with a correlation coefficient (R) of 0.264 and weighted average of 6.0%, a difference of 13.0%.
Unemployment Among Ages 65 to 74 years Correlation Summary
| Measurement | Ukrainian | Delaware |
| Minimum | 3.9% | 0.80% |
| Maximum | 43.9% | 28.2% |
| Range | 40.0% | 27.4% |
| Mean | 9.9% | 9.2% |
| Median | 5.8% | 8.3% |
| Interquartile 25% (IQ1) | 4.8% | 5.2% |
| Interquartile 75% (IQ3) | 11.8% | 11.7% |
| Interquartile Range (IQR) | 7.0% | 6.5% |
| Standard Deviation (Sample) | 9.3% | 5.9% |
| Standard Deviation (Population) | 9.1% | 5.8% |
Similar Demographics by Unemployment Among Ages 65 to 74 years
Demographics Similar to Ukrainians by Unemployment Among Ages 65 to 74 years
In terms of unemployment among ages 65 to 74 years, the demographic groups most similar to Ukrainians are Immigrants from Panama (5.3%, a difference of 0.010%), Immigrants from Serbia (5.3%, a difference of 0.010%), Korean (5.3%, a difference of 0.030%), Immigrants from Russia (5.3%, a difference of 0.060%), and Celtic (5.3%, a difference of 0.070%).
| Demographics | Rating | Rank | Unemployment Among Ages 65 to 74 years |
| Immigrants | South Eastern Asia | 87.2 /100 | #126 | Excellent 5.3% |
| Immigrants | North America | 86.7 /100 | #127 | Excellent 5.3% |
| Immigrants | Hong Kong | 86.5 /100 | #128 | Excellent 5.3% |
| Immigrants | England | 86.2 /100 | #129 | Excellent 5.3% |
| Eastern Europeans | 85.6 /100 | #130 | Excellent 5.3% |
| Immigrants | Russia | 83.0 /100 | #131 | Excellent 5.3% |
| Koreans | 82.6 /100 | #132 | Excellent 5.3% |
| Ukrainians | 82.0 /100 | #133 | Excellent 5.3% |
| Immigrants | Panama | 81.8 /100 | #134 | Excellent 5.3% |
| Immigrants | Serbia | 81.8 /100 | #135 | Excellent 5.3% |
| Celtics | 80.8 /100 | #136 | Excellent 5.3% |
| Immigrants | Afghanistan | 80.8 /100 | #137 | Excellent 5.3% |
| Chileans | 79.7 /100 | #138 | Good 5.3% |
| Finns | 79.0 /100 | #139 | Good 5.3% |
| Immigrants | Laos | 78.6 /100 | #140 | Good 5.3% |
Demographics Similar to Delaware by Unemployment Among Ages 65 to 74 years
In terms of unemployment among ages 65 to 74 years, the demographic groups most similar to Delaware are Immigrants from Mexico (6.0%, a difference of 0.060%), Immigrants from Dominica (6.0%, a difference of 0.28%), Tohono O'odham (6.0%, a difference of 0.58%), Immigrants from Bahamas (5.9%, a difference of 0.65%), and Immigrants from Portugal (6.0%, a difference of 0.69%).
| Demographics | Rating | Rank | Unemployment Among Ages 65 to 74 years |
| Immigrants | El Salvador | 0.0 /100 | #316 | Tragic 5.9% |
| Immigrants | Central America | 0.0 /100 | #317 | Tragic 5.9% |
| Zimbabweans | 0.0 /100 | #318 | Tragic 5.9% |
| Aleuts | 0.0 /100 | #319 | Tragic 5.9% |
| Immigrants | Bahamas | 0.0 /100 | #320 | Tragic 5.9% |
| Immigrants | Dominica | 0.0 /100 | #321 | Tragic 6.0% |
| Immigrants | Mexico | 0.0 /100 | #322 | Tragic 6.0% |
| Delaware | 0.0 /100 | #323 | Tragic 6.0% |
| Tohono O'odham | 0.0 /100 | #324 | Tragic 6.0% |
| Immigrants | Portugal | 0.0 /100 | #325 | Tragic 6.0% |
| Natives/Alaskans | 0.0 /100 | #326 | Tragic 6.0% |
| Shoshone | 0.0 /100 | #327 | Tragic 6.2% |
| Immigrants | Azores | 0.0 /100 | #328 | Tragic 6.2% |
| Yuman | 0.0 /100 | #329 | Tragic 6.2% |
| Dominicans | 0.0 /100 | #330 | Tragic 6.3% |