Ugandan vs Immigrants from Japan Male Unemployment

COMPARE

Ugandan
Race
Ancestry
AfghanAfricanAlaska NativeAlaskan AthabascanAlbanianAleutAlsatianAmericanApacheArabArapahoArgentineanArmenianAssyrian/Chaldean/SyriacAustralianAustrianBahamianBangladeshiBarbadianBasqueBelgianBelizeanBermudanBhutaneseBlackfeetBolivianBrazilianBritishBritish West IndianBulgarianBurmeseCajunCambodianCanadianCape VerdeanCarpatho RusynCelticCentral AmericanCentral American IndianCherokeeCheyenneChickasawChileanChineseChippewaChoctawColombianColvilleComancheCosta RicanCreeCreekCroatianCrowCubanCypriotCzechCzechoslovakianDanishDelawareDominicanDutchDutch West IndianEastern EuropeanEcuadorianEgyptianEnglishEstonianEthiopianEuropeanFijianFilipinoFinnishFrenchFrench American IndianFrench CanadianGermanGerman RussianGhanaianGreekGuamanian/ChamorroGuatemalanGuyaneseHaitianHmongHonduranHopiHoumaHungarianIcelanderIndian (Asian)IndonesianInupiatIranianIraqiIrishIroquoisIsraeliItalianJamaicanJapaneseJordanianKenyanKiowaKoreanLaotianLatvianLebaneseLiberianLithuanianLumbeeLuxembourgerMacedonianMalaysianMalteseMarshalleseMenomineeMexicanMexican American IndianMongolianMoroccanNative HawaiianNavajoNepaleseNew ZealanderNicaraguanNigerianNorthern EuropeanNorwegianOkinawanOsageOttawaPaiutePakistaniPalestinianPanamanianParaguayanPennsylvania GermanPeruvianPimaPolishPortuguesePotawatomiPuebloPuerto RicanPuget Sound SalishRomanianRussianSalvadoranSamoanScandinavianScotch-IrishScottishSeminoleSenegaleseSerbianShoshoneSierra LeoneanSiouxSlavicSlovakSloveneSomaliSouth AfricanSouth AmericanSouth American IndianSoviet UnionSpaniardSpanishSpanish AmericanSpanish American IndianSri LankanSubsaharan AfricanSudaneseSwedishSwissSyrianTaiwaneseThaiTlingit-HaidaTohono O'OdhamTonganTrinidadian and TobagonianTsimshianTurkishU.S. Virgin IslanderUgandanUkrainianUruguayanUteVenezuelanVietnameseWelshWest IndianYakamaYaquiYugoslavianYumanYup'ikZimbabwean
Immigration
NonimmigrantsImmigrantsAfghanistanAfricaAlbaniaArgentinaArmeniaAsiaAustraliaAustriaBahamasBangladeshBarbadosBelarusBelgiumBelizeBoliviaBosnia and HerzegovinaBrazilBulgariaBurma/MyanmarCabo VerdeCambodiaCameroonCanadaCaribbeanCentral AmericaChileChinaColombiaCongoCosta RicaCroatiaCubaCzechoslovakiaDenmarkDominicaDominican RepublicEastern AfricaEastern AsiaEastern EuropeEcuadorEgyptEl SalvadorEnglandEritreaEthiopiaEuropeFijiFranceGermanyGhanaGreeceGrenadaGuatemalaGuyanaHaitiHondurasHong KongHungaryIndiaIndonesiaIranIraqIrelandIsraelItalyJamaicaJordanKazakhstanKenyaKoreaKuwaitLaosLatin AmericaLatviaLebanonLiberiaLithuaniaMalaysiaMexicoMicronesiaMiddle AfricaMoldovaMoroccoNepalNetherlandsNicaraguaNigeriaNorth AmericaNorth MacedoniaNorthern AfricaNorthern EuropeNorwayOceaniaPakistanPanamaPeruPhilippinesPolandPortugalRomaniaRussiaSaudi ArabiaScotlandSenegalSerbiaSierra LeoneSingaporeSomaliaSouth AfricaSouth AmericaSouth Central AsiaSouth Eastern AsiaSouthern EuropeSpainSri LankaSt. Vincent and the GrenadinesSudanSwedenSwitzerlandSyriaTaiwanThailandTrinidad and TobagoTurkeyUgandaUkraineUruguayUzbekistanVenezuelaVietnamWest IndiesWestern AfricaWestern AsiaWestern EuropeYemenZaireZimbabweAzores
Immigrants from Japan
Race
Ancestry
AfghanAfricanAlaska NativeAlaskan AthabascanAlbanianAleutAlsatianAmericanApacheArabArapahoArgentineanArmenianAssyrian/Chaldean/SyriacAustralianAustrianBahamianBangladeshiBarbadianBasqueBelgianBelizeanBermudanBhutaneseBlackfeetBolivianBrazilianBritishBritish West IndianBulgarianBurmeseCajunCambodianCanadianCape VerdeanCarpatho RusynCelticCentral AmericanCentral American IndianCherokeeCheyenneChickasawChileanChineseChippewaChoctawColombianColvilleComancheCosta RicanCreeCreekCroatianCrowCubanCypriotCzechCzechoslovakianDanishDelawareDominicanDutchDutch West IndianEastern EuropeanEcuadorianEgyptianEnglishEstonianEthiopianEuropeanFijianFilipinoFinnishFrenchFrench American IndianFrench CanadianGermanGerman RussianGhanaianGreekGuamanian/ChamorroGuatemalanGuyaneseHaitianHmongHonduranHopiHoumaHungarianIcelanderIndian (Asian)IndonesianInupiatIranianIraqiIrishIroquoisIsraeliItalianJamaicanJapaneseJordanianKenyanKiowaKoreanLaotianLatvianLebaneseLiberianLithuanianLumbeeLuxembourgerMacedonianMalaysianMalteseMarshalleseMenomineeMexicanMexican American IndianMongolianMoroccanNative HawaiianNavajoNepaleseNew ZealanderNicaraguanNigerianNorthern EuropeanNorwegianOkinawanOsageOttawaPaiutePakistaniPalestinianPanamanianParaguayanPennsylvania GermanPeruvianPimaPolishPortuguesePotawatomiPuebloPuerto RicanPuget Sound SalishRomanianRussianSalvadoranSamoanScandinavianScotch-IrishScottishSeminoleSenegaleseSerbianShoshoneSierra LeoneanSiouxSlavicSlovakSloveneSomaliSouth AfricanSouth AmericanSouth American IndianSoviet UnionSpaniardSpanishSpanish AmericanSpanish American IndianSri LankanSubsaharan AfricanSudaneseSwedishSwissSyrianTaiwaneseThaiTlingit-HaidaTohono O'OdhamTonganTrinidadian and TobagonianTsimshianTurkishU.S. Virgin IslanderUkrainianUruguayanUteVenezuelanVietnameseWelshWest IndianYakamaYaquiYugoslavianYumanYup'ikZimbabwean
Immigration
NonimmigrantsImmigrantsAfghanistanAfricaAlbaniaArgentinaArmeniaAsiaAustraliaAustriaBahamasBangladeshBarbadosBelarusBelgiumBelizeBoliviaBosnia and HerzegovinaBrazilBulgariaBurma/MyanmarCabo VerdeCambodiaCameroonCanadaCaribbeanCentral AmericaChileChinaColombiaCongoCosta RicaCroatiaCubaCzechoslovakiaDenmarkDominicaDominican RepublicEastern AfricaEastern AsiaEastern EuropeEcuadorEgyptEl SalvadorEnglandEritreaEthiopiaEuropeFijiFranceGermanyGhanaGreeceGrenadaGuatemalaGuyanaHaitiHondurasHong KongHungaryIndiaIndonesiaIranIraqIrelandIsraelItalyJamaicaJapanJordanKazakhstanKenyaKoreaKuwaitLaosLatin AmericaLatviaLebanonLiberiaLithuaniaMalaysiaMexicoMicronesiaMiddle AfricaMoldovaMoroccoNepalNetherlandsNicaraguaNigeriaNorth AmericaNorth MacedoniaNorthern AfricaNorthern EuropeNorwayOceaniaPakistanPanamaPeruPhilippinesPolandPortugalRomaniaRussiaSaudi ArabiaScotlandSenegalSerbiaSierra LeoneSingaporeSomaliaSouth AfricaSouth AmericaSouth Central AsiaSouth Eastern AsiaSouthern EuropeSpainSri LankaSt. Vincent and the GrenadinesSudanSwedenSwitzerlandSyriaTaiwanThailandTrinidad and TobagoTurkeyUgandaUkraineUruguayUzbekistanVenezuelaVietnamWest IndiesWestern AfricaWestern AsiaWestern EuropeYemenZaireZimbabweAzores
Male Unemployment
Income
Poverty
Unemployment
Labor Participation
Family Structure
Vehicle Availability
Education Level
Disability

Male Unemployment Comparison

Ugandans

Immigrants from Japan

Tragic
Exceptional
5.5%
MALE UNEMPLOYMENT
6.3/ 100
METRIC RATING
213th/ 347
METRIC RANK
4.9%
MALE UNEMPLOYMENT
99.2/ 100
METRIC RATING
43rd/ 347
METRIC RANK

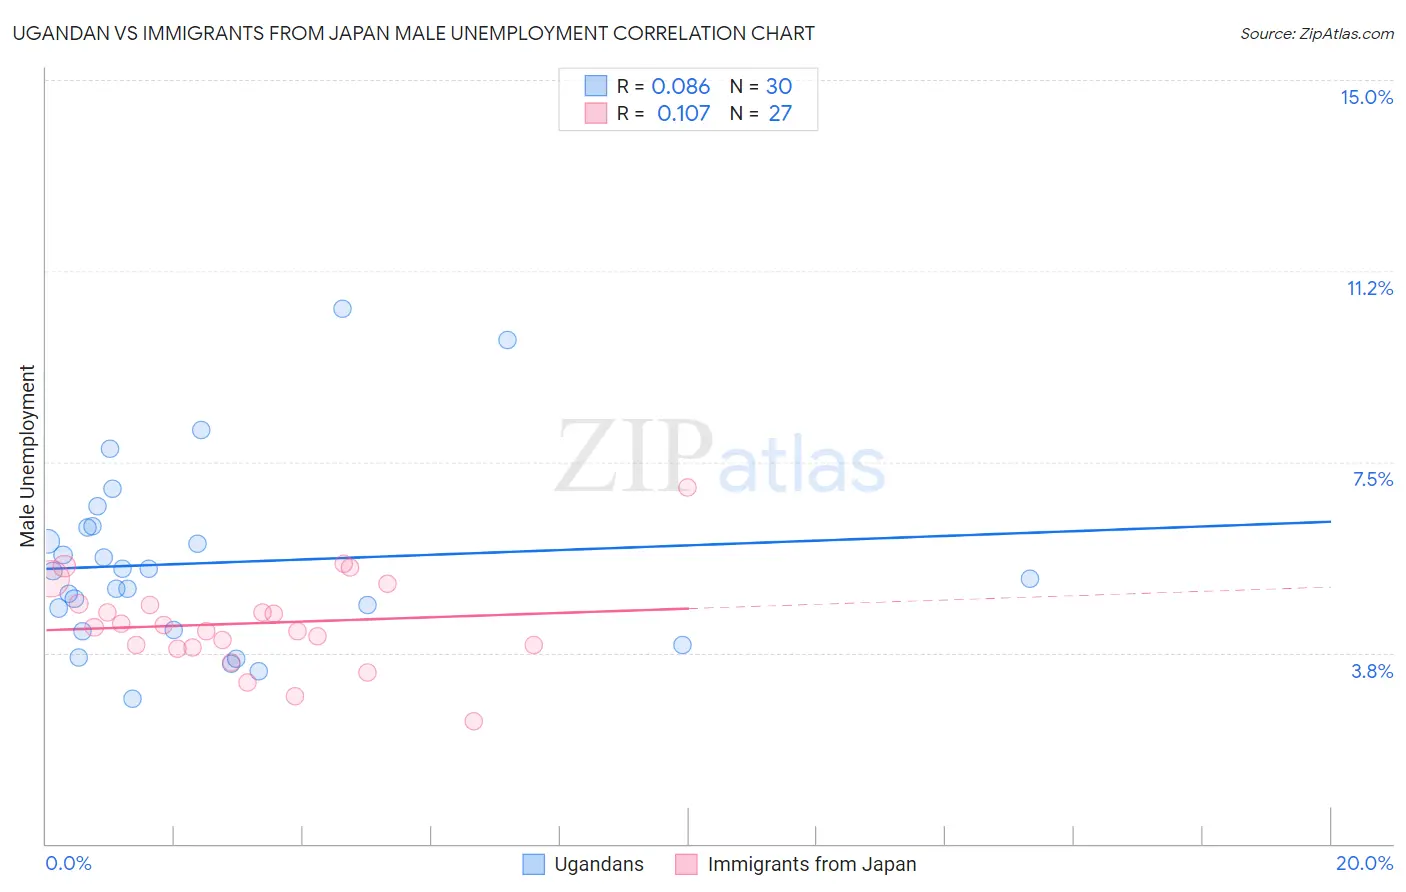
Ugandan vs Immigrants from Japan Male Unemployment Correlation Chart

The statistical analysis conducted on geographies consisting of 93,962,786 people shows a slight positive correlation between the proportion of Ugandans and unemployment rate among males in the United States with a correlation coefficient (R) of 0.086 and weighted average of 5.5%. Similarly, the statistical analysis conducted on geographies consisting of 339,113,647 people shows a poor positive correlation between the proportion of Immigrants from Japan and unemployment rate among males in the United States with a correlation coefficient (R) of 0.107 and weighted average of 4.9%, a difference of 11.8%.
Ugandan vs Immigrants from Japan Male Unemployment

Male Unemployment Correlation Summary

MeasurementUgandanImmigrants from Japan
Minimum2.8%2.4%
Maximum10.5%7.0%
Range7.7%4.6%
Mean5.5%4.3%
Median5.3%4.3%
Interquartile 25% (IQ1)4.2%3.8%
Interquartile 75% (IQ3)6.2%4.7%
Interquartile Range (IQR)2.0%0.88%
Standard Deviation (Sample)1.8%0.93%
Standard Deviation (Population)1.8%0.91%

Similar Demographics by Male Unemployment

Demographics Similar to Ugandans by Male Unemployment

In terms of male unemployment, the demographic groups most similar to Ugandans are Hmong (5.5%, a difference of 0.16%), Puget Sound Salish (5.5%, a difference of 0.17%), Israeli (5.5%, a difference of 0.25%), South American Indian (5.5%, a difference of 0.30%), and Samoan (5.5%, a difference of 0.37%).
DemographicsRating | RankMale Unemployment
Immigrants | Ukraine
9.9
/100
|
#206
Tragic
5.5%
Immigrants | Syria
9.3
/100
|
#207
Tragic
5.5%
Immigrants | Lebanon
8.6
/100
|
#208
Tragic
5.5%
Immigrants | Middle Africa
8.3
/100
|
#209
Tragic
5.5%
South American Indians
7.6
/100
|
#210
Tragic
5.5%
Israelis
7.4
/100
|
#211
Tragic
5.5%
Hmong
7.0
/100
|
#212
Tragic
5.5%
Ugandans
6.3
/100
|
#213
Tragic
5.5%
Puget Sound Salish
5.6
/100
|
#214
Tragic
5.5%
Samoans
4.9
/100
|
#215
Tragic
5.5%
Immigrants | Immigrants
4.3
/100
|
#216
Tragic
5.5%
Delaware
4.2
/100
|
#217
Tragic
5.5%
Immigrants | Albania
3.6
/100
|
#218
Tragic
5.5%
Immigrants | Western Asia
3.5
/100
|
#219
Tragic
5.6%
Portuguese
3.5
/100
|
#220
Tragic
5.6%

Demographics Similar to Immigrants from Japan by Male Unemployment

In terms of male unemployment, the demographic groups most similar to Immigrants from Japan are Immigrants from Belgium (4.9%, a difference of 0.10%), Chinese (4.9%, a difference of 0.13%), Immigrants from Korea (4.9%, a difference of 0.18%), Northern European (4.9%, a difference of 0.21%), and Burmese (4.9%, a difference of 0.29%).
DemographicsRating | RankMale Unemployment
Immigrants | Singapore
99.4
/100
|
#36
Exceptional
4.9%
Scotch-Irish
99.4
/100
|
#37
Exceptional
4.9%
Immigrants | Bosnia and Herzegovina
99.4
/100
|
#38
Exceptional
4.9%
Burmese
99.3
/100
|
#39
Exceptional
4.9%
Northern Europeans
99.3
/100
|
#40
Exceptional
4.9%
Chinese
99.3
/100
|
#41
Exceptional
4.9%
Immigrants | Belgium
99.2
/100
|
#42
Exceptional
4.9%
Immigrants | Japan
99.2
/100
|
#43
Exceptional
4.9%
Immigrants | Korea
99.1
/100
|
#44
Exceptional
4.9%
Immigrants | Zimbabwe
99.0
/100
|
#45
Exceptional
4.9%
Bhutanese
98.9
/100
|
#46
Exceptional
4.9%
Austrians
98.9
/100
|
#47
Exceptional
4.9%
Immigrants | Scotland
98.9
/100
|
#48
Exceptional
4.9%
Poles
98.9
/100
|
#49
Exceptional
4.9%
Croatians
98.9
/100
|
#50
Exceptional
4.9%