Ugandan vs Immigrants from Cameroon Unemployment Among Ages 60 to 64 years
COMPARE
Ugandan
Immigrants from Cameroon
Unemployment Among Ages 60 to 64 years
Unemployment Among Ages 60 to 64 years Comparison
Ugandans
Immigrants from Cameroon
4.9%
UNEMPLOYMENT AMONG AGES 60 TO 64 YEARS
10.5/ 100
METRIC RATING
221st/ 347
METRIC RANK
5.0%
UNEMPLOYMENT AMONG AGES 60 TO 64 YEARS
8.5/ 100
METRIC RATING
224th/ 347
METRIC RANK
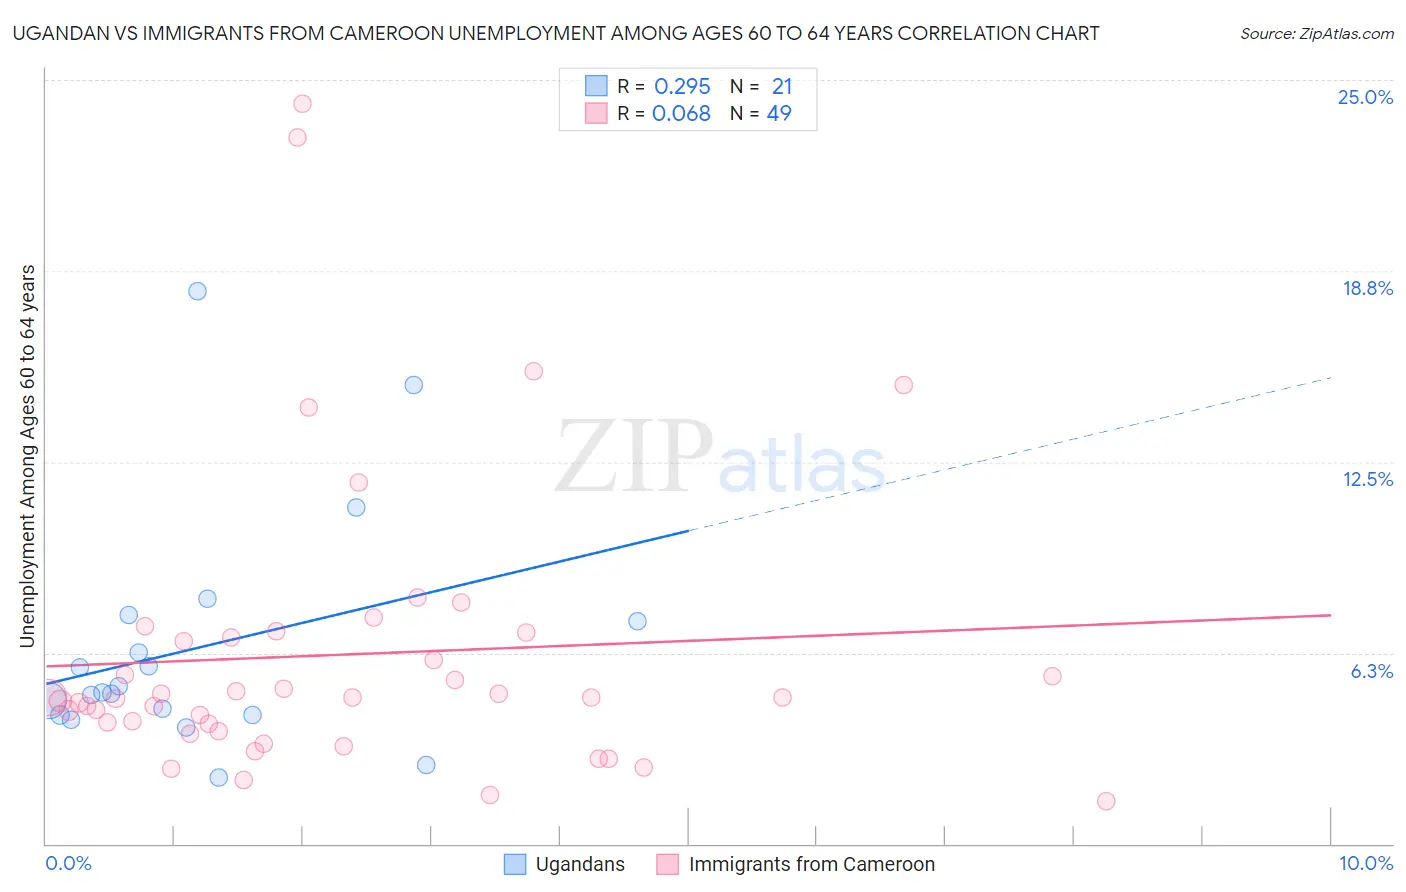
Ugandan vs Immigrants from Cameroon Unemployment Among Ages 60 to 64 years Correlation Chart
The statistical analysis conducted on geographies consisting of 91,721,696 people shows a weak positive correlation between the proportion of Ugandans and unemployment rate among population between the ages 60 and 64 in the United States with a correlation coefficient (R) of 0.295 and weighted average of 4.9%. Similarly, the statistical analysis conducted on geographies consisting of 125,328,577 people shows a slight positive correlation between the proportion of Immigrants from Cameroon and unemployment rate among population between the ages 60 and 64 in the United States with a correlation coefficient (R) of 0.068 and weighted average of 5.0%, a difference of 0.20%.
Unemployment Among Ages 60 to 64 years Correlation Summary
| Measurement | Ugandan | Immigrants from Cameroon |
| Minimum | 2.2% | 1.4% |
| Maximum | 18.1% | 24.2% |
| Range | 16.0% | 22.8% |
| Mean | 6.4% | 6.2% |
| Median | 4.9% | 4.8% |
| Interquartile 25% (IQ1) | 4.2% | 3.8% |
| Interquartile 75% (IQ3) | 7.4% | 6.8% |
| Interquartile Range (IQR) | 3.2% | 3.0% |
| Standard Deviation (Sample) | 3.9% | 4.8% |
| Standard Deviation (Population) | 3.8% | 4.7% |
Demographics Similar to Ugandans and Immigrants from Cameroon by Unemployment Among Ages 60 to 64 years
In terms of unemployment among ages 60 to 64 years, the demographic groups most similar to Ugandans are Brazilian (5.0%, a difference of 0.040%), Crow (5.0%, a difference of 0.080%), Ottawa (4.9%, a difference of 0.10%), Immigrants from Brazil (4.9%, a difference of 0.11%), and Immigrants from Singapore (4.9%, a difference of 0.13%). Similarly, the demographic groups most similar to Immigrants from Cameroon are Crow (5.0%, a difference of 0.12%), Brazilian (5.0%, a difference of 0.16%), Immigrants from Ireland (5.0%, a difference of 0.16%), Immigrants from Chile (5.0%, a difference of 0.21%), and Nigerian (5.0%, a difference of 0.21%).
| Demographics | Rating | Rank | Unemployment Among Ages 60 to 64 years |
| Moroccans | 15.0 /100 | #212 | Poor 4.9% |
| Eastern Europeans | 14.3 /100 | #213 | Poor 4.9% |
| Immigrants | Russia | 13.7 /100 | #214 | Poor 4.9% |
| Immigrants | South Eastern Asia | 13.1 /100 | #215 | Poor 4.9% |
| Cajuns | 12.3 /100 | #216 | Poor 4.9% |
| Koreans | 12.2 /100 | #217 | Poor 4.9% |
| Immigrants | Singapore | 12.0 /100 | #218 | Poor 4.9% |
| Immigrants | Brazil | 11.7 /100 | #219 | Poor 4.9% |
| Ottawa | 11.6 /100 | #220 | Poor 4.9% |
| Ugandans | 10.5 /100 | #221 | Poor 4.9% |
| Brazilians | 10.1 /100 | #222 | Poor 5.0% |
| Crow | 9.7 /100 | #223 | Tragic 5.0% |
| Immigrants | Cameroon | 8.5 /100 | #224 | Tragic 5.0% |
| Immigrants | Ireland | 7.2 /100 | #225 | Tragic 5.0% |
| Immigrants | Chile | 6.8 /100 | #226 | Tragic 5.0% |
| Nigerians | 6.8 /100 | #227 | Tragic 5.0% |
| Immigrants | Belarus | 6.4 /100 | #228 | Tragic 5.0% |
| Africans | 5.9 /100 | #229 | Tragic 5.0% |
| Immigrants | Denmark | 5.8 /100 | #230 | Tragic 5.0% |
| Tohono O'odham | 5.7 /100 | #231 | Tragic 5.0% |
| Immigrants | Eastern Asia | 4.7 /100 | #232 | Tragic 5.0% |