Turkish vs Immigrants from Zimbabwe Unemployment Among Ages 25 to 29 years
COMPARE
Turkish
Immigrants from Zimbabwe
Unemployment Among Ages 25 to 29 years
Unemployment Among Ages 25 to 29 years Comparison
Turks
Immigrants from Zimbabwe
6.2%
UNEMPLOYMENT AMONG AGES 25 TO 29 YEARS
98.8/ 100
METRIC RATING
53rd/ 347
METRIC RANK
6.1%
UNEMPLOYMENT AMONG AGES 25 TO 29 YEARS
99.5/ 100
METRIC RATING
35th/ 347
METRIC RANK
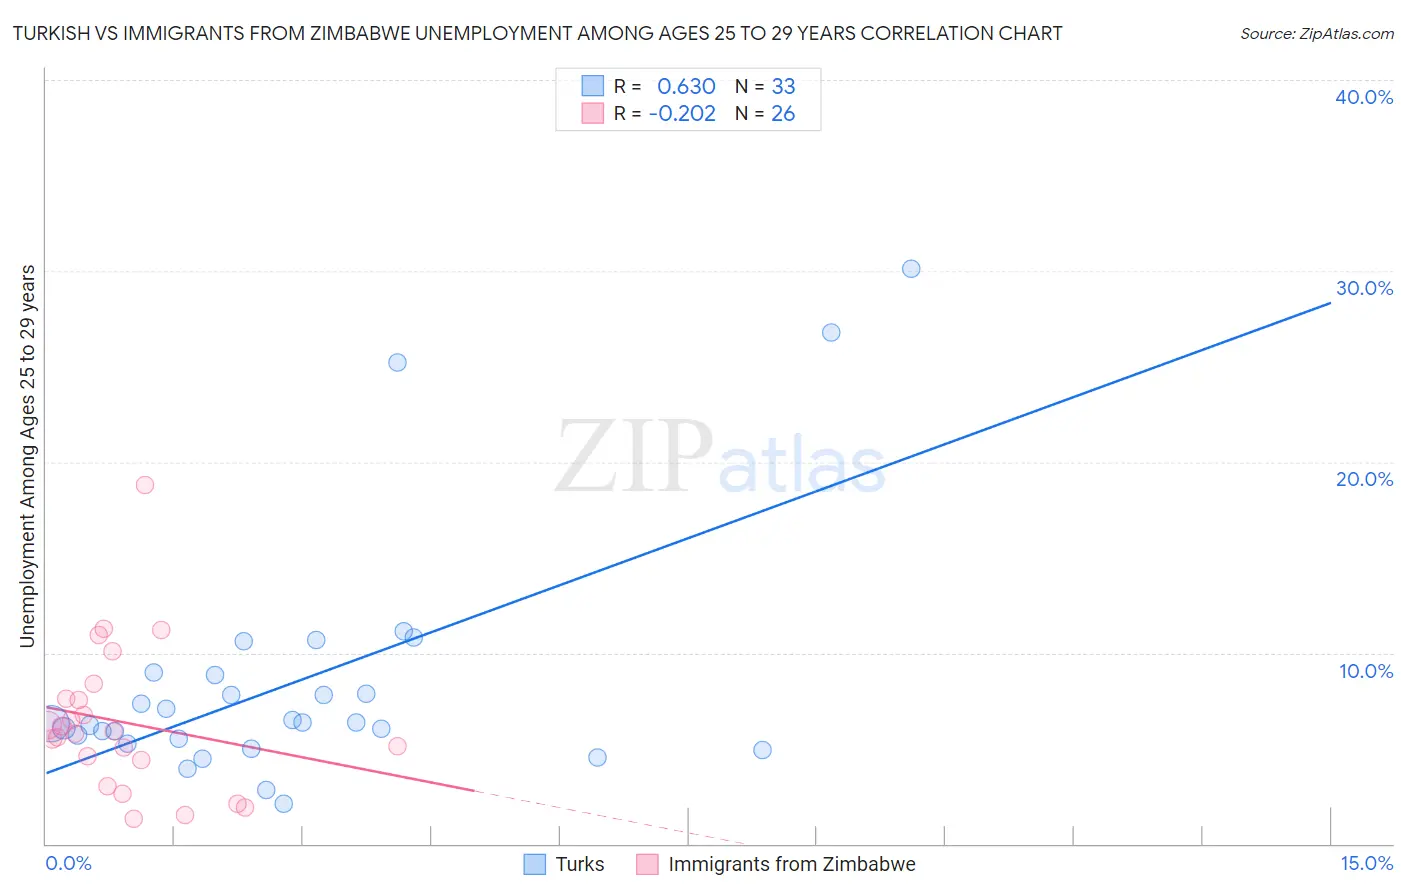
Turkish vs Immigrants from Zimbabwe Unemployment Among Ages 25 to 29 years Correlation Chart
The statistical analysis conducted on geographies consisting of 263,158,827 people shows a significant positive correlation between the proportion of Turks and unemployment rate among population between the ages 25 and 29 in the United States with a correlation coefficient (R) of 0.630 and weighted average of 6.2%. Similarly, the statistical analysis conducted on geographies consisting of 116,035,324 people shows a weak negative correlation between the proportion of Immigrants from Zimbabwe and unemployment rate among population between the ages 25 and 29 in the United States with a correlation coefficient (R) of -0.202 and weighted average of 6.1%, a difference of 1.4%.
Unemployment Among Ages 25 to 29 years Correlation Summary
| Measurement | Turkish | Immigrants from Zimbabwe |
| Minimum | 2.1% | 1.3% |
| Maximum | 30.1% | 18.8% |
| Range | 28.0% | 17.5% |
| Mean | 8.5% | 6.4% |
| Median | 6.3% | 5.8% |
| Interquartile 25% (IQ1) | 5.4% | 4.4% |
| Interquartile 75% (IQ3) | 8.9% | 7.6% |
| Interquartile Range (IQR) | 3.5% | 3.2% |
| Standard Deviation (Sample) | 6.5% | 3.8% |
| Standard Deviation (Population) | 6.4% | 3.8% |
Demographics Similar to Turks and Immigrants from Zimbabwe by Unemployment Among Ages 25 to 29 years
In terms of unemployment among ages 25 to 29 years, the demographic groups most similar to Turks are Swedish (6.2%, a difference of 0.020%), Immigrants from Turkey (6.2%, a difference of 0.060%), Burmese (6.2%, a difference of 0.11%), Soviet Union (6.2%, a difference of 0.14%), and German Russian (6.2%, a difference of 0.20%). Similarly, the demographic groups most similar to Immigrants from Zimbabwe are Taiwanese (6.1%, a difference of 0.020%), Immigrants from Morocco (6.1%, a difference of 0.040%), Immigrants from Serbia (6.1%, a difference of 0.070%), Ethiopian (6.1%, a difference of 0.21%), and Indonesian (6.1%, a difference of 0.41%).
| Demographics | Rating | Rank | Unemployment Among Ages 25 to 29 years |
| Immigrants | Morocco | 99.5 /100 | #34 | Exceptional 6.1% |
| Immigrants | Zimbabwe | 99.5 /100 | #35 | Exceptional 6.1% |
| Taiwanese | 99.5 /100 | #36 | Exceptional 6.1% |
| Immigrants | Serbia | 99.5 /100 | #37 | Exceptional 6.1% |
| Ethiopians | 99.4 /100 | #38 | Exceptional 6.1% |
| Indonesians | 99.3 /100 | #39 | Exceptional 6.1% |
| Immigrants | Kenya | 99.3 /100 | #40 | Exceptional 6.1% |
| Fijians | 99.3 /100 | #41 | Exceptional 6.1% |
| Jordanians | 99.3 /100 | #42 | Exceptional 6.1% |
| Czechs | 99.2 /100 | #43 | Exceptional 6.2% |
| Mongolians | 99.2 /100 | #44 | Exceptional 6.2% |
| Venezuelans | 99.1 /100 | #45 | Exceptional 6.2% |
| Immigrants | Lithuania | 99.0 /100 | #46 | Exceptional 6.2% |
| Latvians | 99.0 /100 | #47 | Exceptional 6.2% |
| Immigrants | Australia | 99.0 /100 | #48 | Exceptional 6.2% |
| German Russians | 99.0 /100 | #49 | Exceptional 6.2% |
| Soviet Union | 98.9 /100 | #50 | Exceptional 6.2% |
| Burmese | 98.9 /100 | #51 | Exceptional 6.2% |
| Immigrants | Turkey | 98.9 /100 | #52 | Exceptional 6.2% |
| Turks | 98.8 /100 | #53 | Exceptional 6.2% |
| Swedes | 98.8 /100 | #54 | Exceptional 6.2% |