Trinidadian and Tobagonian vs Inupiat Male Unemployment
COMPARE
Trinidadian and Tobagonian
Inupiat
Male Unemployment
Male Unemployment Comparison
Trinidadians and Tobagonians
Inupiat
6.7%
MALE UNEMPLOYMENT
0.0/ 100
METRIC RATING
305th/ 347
METRIC RANK
12.1%
MALE UNEMPLOYMENT
0.0/ 100
METRIC RATING
346th/ 347
METRIC RANK
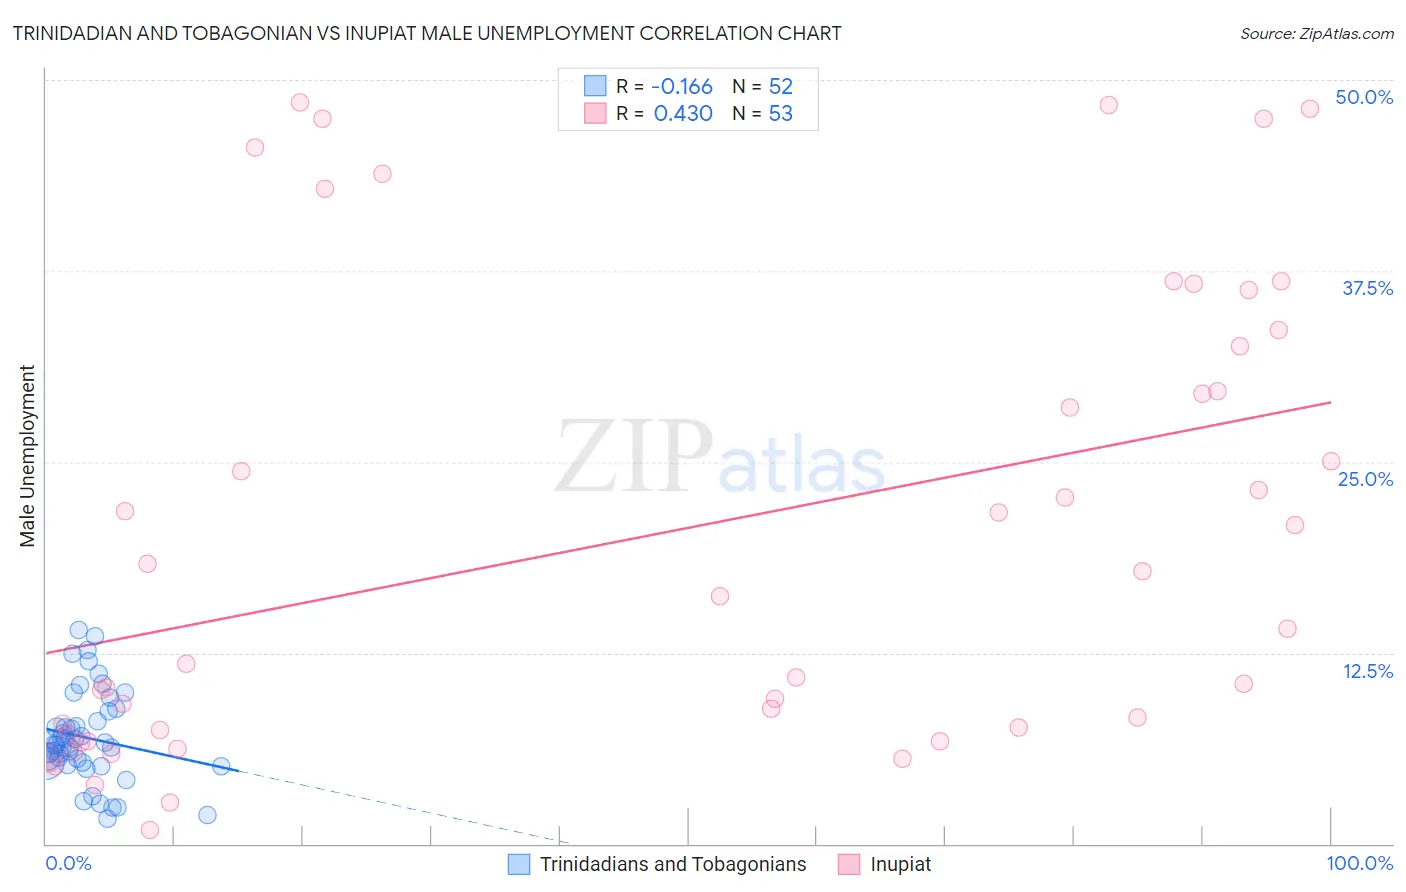
Trinidadian and Tobagonian vs Inupiat Male Unemployment Correlation Chart
The statistical analysis conducted on geographies consisting of 219,443,650 people shows a poor negative correlation between the proportion of Trinidadians and Tobagonians and unemployment rate among males in the United States with a correlation coefficient (R) of -0.166 and weighted average of 6.7%. Similarly, the statistical analysis conducted on geographies consisting of 96,169,254 people shows a moderate positive correlation between the proportion of Inupiat and unemployment rate among males in the United States with a correlation coefficient (R) of 0.430 and weighted average of 12.1%, a difference of 80.7%.
Male Unemployment Correlation Summary
| Measurement | Trinidadian and Tobagonian | Inupiat |
| Minimum | 1.6% | 0.90% |
| Maximum | 14.0% | 48.5% |
| Range | 12.4% | 47.6% |
| Mean | 6.9% | 20.4% |
| Median | 6.5% | 16.2% |
| Interquartile 25% (IQ1) | 5.4% | 7.3% |
| Interquartile 75% (IQ3) | 8.4% | 33.1% |
| Interquartile Range (IQR) | 3.0% | 25.8% |
| Standard Deviation (Sample) | 2.9% | 15.0% |
| Standard Deviation (Population) | 2.9% | 14.9% |
Similar Demographics by Male Unemployment
Demographics Similar to Trinidadians and Tobagonians by Male Unemployment
In terms of male unemployment, the demographic groups most similar to Trinidadians and Tobagonians are Immigrants from Trinidad and Tobago (6.7%, a difference of 0.20%), Immigrants from Jamaica (6.7%, a difference of 0.28%), Immigrants from West Indies (6.7%, a difference of 0.32%), West Indian (6.7%, a difference of 0.32%), and Ute (6.6%, a difference of 0.69%).
| Demographics | Rating | Rank | Male Unemployment |
| Jamaicans | 0.0 /100 | #298 | Tragic 6.6% |
| Immigrants | Bangladesh | 0.0 /100 | #299 | Tragic 6.6% |
| Vietnamese | 0.0 /100 | #300 | Tragic 6.6% |
| Immigrants | Belize | 0.0 /100 | #301 | Tragic 6.6% |
| Ute | 0.0 /100 | #302 | Tragic 6.6% |
| Immigrants | West Indies | 0.0 /100 | #303 | Tragic 6.7% |
| West Indians | 0.0 /100 | #304 | Tragic 6.7% |
| Trinidadians and Tobagonians | 0.0 /100 | #305 | Tragic 6.7% |
| Immigrants | Trinidad and Tobago | 0.0 /100 | #306 | Tragic 6.7% |
| Immigrants | Jamaica | 0.0 /100 | #307 | Tragic 6.7% |
| Aleuts | 0.0 /100 | #308 | Tragic 6.8% |
| Barbadians | 0.0 /100 | #309 | Tragic 6.9% |
| Blacks/African Americans | 0.0 /100 | #310 | Tragic 6.9% |
| Immigrants | Armenia | 0.0 /100 | #311 | Tragic 6.9% |
| Lumbee | 0.0 /100 | #312 | Tragic 6.9% |
Demographics Similar to Inupiat by Male Unemployment
In terms of male unemployment, the demographic groups most similar to Inupiat are Arapaho (11.0%, a difference of 9.8%), Hopi (10.8%, a difference of 12.0%), Crow (10.6%, a difference of 13.8%), Tohono O'odham (10.2%, a difference of 18.8%), and Navajo (9.8%, a difference of 22.9%).
| Demographics | Rating | Rank | Male Unemployment |
| Sioux | 0.0 /100 | #333 | Tragic 8.4% |
| Tsimshian | 0.0 /100 | #334 | Tragic 8.5% |
| Pueblo | 0.0 /100 | #335 | Tragic 8.5% |
| Yuman | 0.0 /100 | #336 | Tragic 8.6% |
| Puerto Ricans | 0.0 /100 | #337 | Tragic 8.6% |
| Apache | 0.0 /100 | #338 | Tragic 8.6% |
| Cheyenne | 0.0 /100 | #339 | Tragic 9.8% |
| Alaskan Athabascans | 0.0 /100 | #340 | Tragic 9.8% |
| Navajo | 0.0 /100 | #341 | Tragic 9.8% |
| Tohono O'odham | 0.0 /100 | #342 | Tragic 10.2% |
| Crow | 0.0 /100 | #343 | Tragic 10.6% |
| Hopi | 0.0 /100 | #344 | Tragic 10.8% |
| Arapaho | 0.0 /100 | #345 | Tragic 11.0% |
| Inupiat | 0.0 /100 | #346 | Tragic 12.1% |
| Yup'ik | 0.0 /100 | #347 | Tragic 16.4% |