Trinidadian and Tobagonian vs Immigrants from Sri Lanka Unemployment Among Women with Children Under 6 years
COMPARE
Trinidadian and Tobagonian
Immigrants from Sri Lanka
Unemployment Among Women with Children Under 6 years
Unemployment Among Women with Children Under 6 years Comparison
Trinidadians and Tobagonians
Immigrants from Sri Lanka
8.0%
UNEMPLOYMENT AMONG WOMEN WITH CHILDREN UNDER 6 YEARS
5.3/ 100
METRIC RATING
231st/ 347
METRIC RANK
6.9%
UNEMPLOYMENT AMONG WOMEN WITH CHILDREN UNDER 6 YEARS
99.8/ 100
METRIC RATING
60th/ 347
METRIC RANK
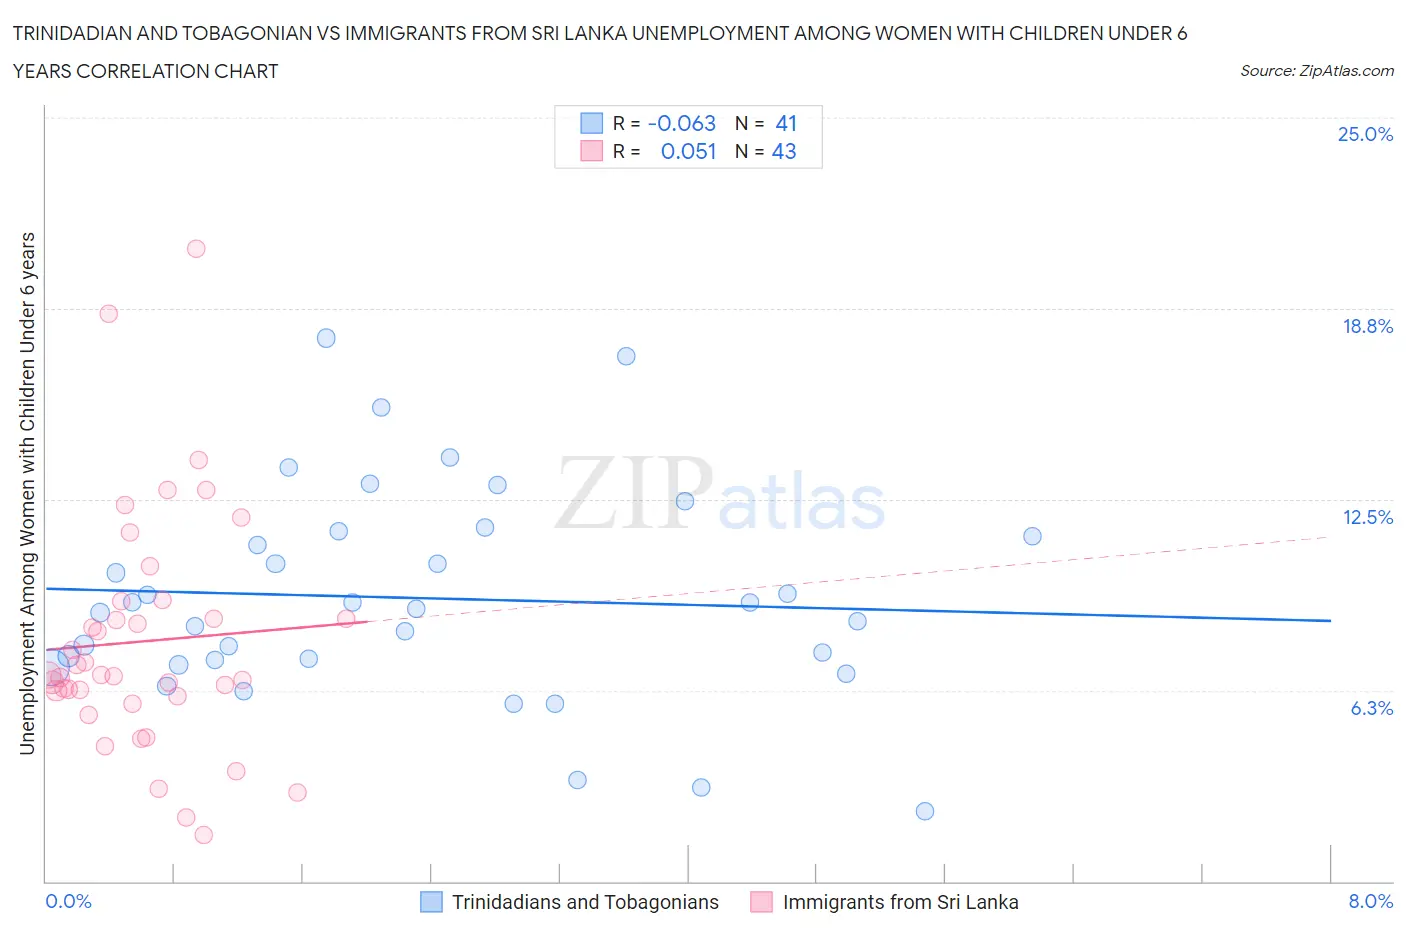
Trinidadian and Tobagonian vs Immigrants from Sri Lanka Unemployment Among Women with Children Under 6 years Correlation Chart
The statistical analysis conducted on geographies consisting of 186,043,752 people shows a slight negative correlation between the proportion of Trinidadians and Tobagonians and unemployment rate among women with children under the age of 6 in the United States with a correlation coefficient (R) of -0.063 and weighted average of 8.0%. Similarly, the statistical analysis conducted on geographies consisting of 131,652,229 people shows a slight positive correlation between the proportion of Immigrants from Sri Lanka and unemployment rate among women with children under the age of 6 in the United States with a correlation coefficient (R) of 0.051 and weighted average of 6.9%, a difference of 16.5%.
Unemployment Among Women with Children Under 6 years Correlation Summary
| Measurement | Trinidadian and Tobagonian | Immigrants from Sri Lanka |
| Minimum | 2.3% | 1.5% |
| Maximum | 17.8% | 20.7% |
| Range | 15.5% | 19.2% |
| Mean | 9.3% | 7.9% |
| Median | 8.9% | 6.7% |
| Interquartile 25% (IQ1) | 7.2% | 6.1% |
| Interquartile 75% (IQ3) | 11.4% | 9.2% |
| Interquartile Range (IQR) | 4.2% | 3.1% |
| Standard Deviation (Sample) | 3.4% | 3.9% |
| Standard Deviation (Population) | 3.4% | 3.8% |
Similar Demographics by Unemployment Among Women with Children Under 6 years
Demographics Similar to Trinidadians and Tobagonians by Unemployment Among Women with Children Under 6 years
In terms of unemployment among women with children under 6 years, the demographic groups most similar to Trinidadians and Tobagonians are Finnish (8.0%, a difference of 0.0%), Salvadoran (8.0%, a difference of 0.070%), Welsh (8.0%, a difference of 0.090%), Immigrants from Trinidad and Tobago (8.0%, a difference of 0.17%), and Immigrants from Sudan (8.0%, a difference of 0.22%).
| Demographics | Rating | Rank | Unemployment Among Women with Children Under 6 years |
| English | 7.2 /100 | #224 | Tragic 8.0% |
| Germans | 7.0 /100 | #225 | Tragic 8.0% |
| Senegalese | 6.2 /100 | #226 | Tragic 8.0% |
| Portuguese | 6.2 /100 | #227 | Tragic 8.0% |
| Immigrants | Sudan | 6.0 /100 | #228 | Tragic 8.0% |
| Salvadorans | 5.5 /100 | #229 | Tragic 8.0% |
| Finns | 5.3 /100 | #230 | Tragic 8.0% |
| Trinidadians and Tobagonians | 5.3 /100 | #231 | Tragic 8.0% |
| Welsh | 5.0 /100 | #232 | Tragic 8.0% |
| Immigrants | Trinidad and Tobago | 4.8 /100 | #233 | Tragic 8.0% |
| Kiowa | 4.4 /100 | #234 | Tragic 8.0% |
| Comanche | 4.3 /100 | #235 | Tragic 8.0% |
| Immigrants | Barbados | 4.2 /100 | #236 | Tragic 8.0% |
| Immigrants | Costa Rica | 4.1 /100 | #237 | Tragic 8.0% |
| Immigrants | Middle Africa | 3.2 /100 | #238 | Tragic 8.1% |
Demographics Similar to Immigrants from Sri Lanka by Unemployment Among Women with Children Under 6 years
In terms of unemployment among women with children under 6 years, the demographic groups most similar to Immigrants from Sri Lanka are Immigrants from Serbia (6.9%, a difference of 0.080%), Immigrants from Turkey (6.9%, a difference of 0.14%), Icelander (6.9%, a difference of 0.37%), Immigrants from France (6.9%, a difference of 0.37%), and Immigrants from Ethiopia (6.9%, a difference of 0.38%).
| Demographics | Rating | Rank | Unemployment Among Women with Children Under 6 years |
| Chinese | 99.9 /100 | #53 | Exceptional 6.8% |
| Immigrants | Latvia | 99.9 /100 | #54 | Exceptional 6.8% |
| Immigrants | Ukraine | 99.8 /100 | #55 | Exceptional 6.8% |
| Immigrants | Ethiopia | 99.8 /100 | #56 | Exceptional 6.9% |
| Icelanders | 99.8 /100 | #57 | Exceptional 6.9% |
| Immigrants | Turkey | 99.8 /100 | #58 | Exceptional 6.9% |
| Immigrants | Serbia | 99.8 /100 | #59 | Exceptional 6.9% |
| Immigrants | Sri Lanka | 99.8 /100 | #60 | Exceptional 6.9% |
| Immigrants | France | 99.7 /100 | #61 | Exceptional 6.9% |
| Somalis | 99.7 /100 | #62 | Exceptional 6.9% |
| Maltese | 99.7 /100 | #63 | Exceptional 6.9% |
| Tongans | 99.7 /100 | #64 | Exceptional 6.9% |
| Immigrants | Kuwait | 99.7 /100 | #65 | Exceptional 6.9% |
| Immigrants | Belgium | 99.6 /100 | #66 | Exceptional 6.9% |
| Immigrants | Netherlands | 99.5 /100 | #67 | Exceptional 7.0% |