Trinidadian and Tobagonian vs Canadian Unemployment Among Youth under 25 years
COMPARE
Trinidadian and Tobagonian
Canadian
Unemployment Among Youth under 25 years
Unemployment Among Youth under 25 years Comparison
Trinidadians and Tobagonians
Canadians
14.6%
UNEMPLOYMENT AMONG YOUTH UNDER 25 YEARS
0.0/ 100
METRIC RATING
322nd/ 347
METRIC RANK
11.4%
UNEMPLOYMENT AMONG YOUTH UNDER 25 YEARS
86.6/ 100
METRIC RATING
126th/ 347
METRIC RANK
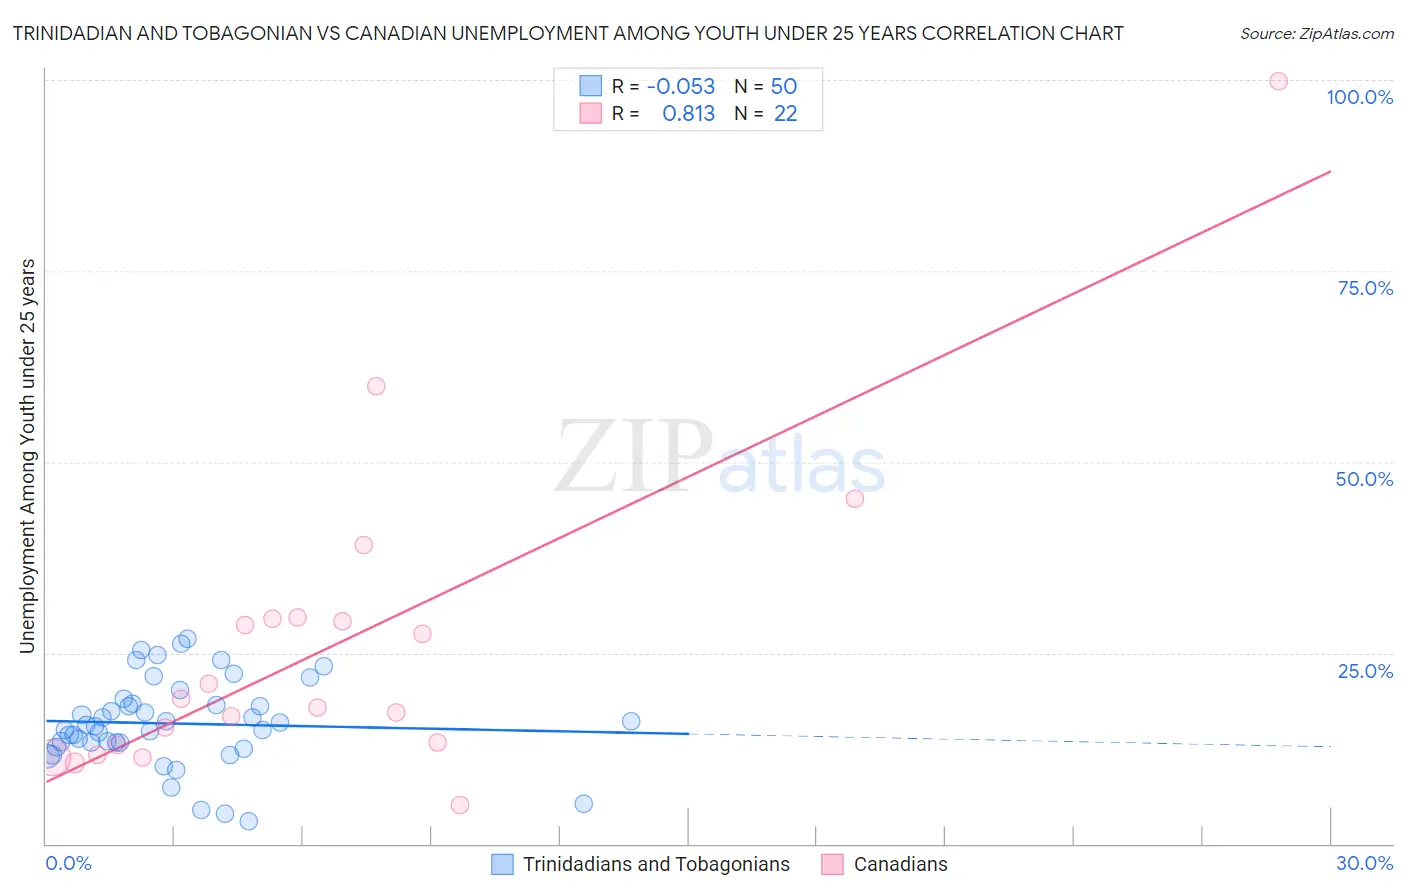
Trinidadian and Tobagonian vs Canadian Unemployment Among Youth under 25 years Correlation Chart
The statistical analysis conducted on geographies consisting of 218,912,692 people shows a slight negative correlation between the proportion of Trinidadians and Tobagonians and unemployment rate among youth under the age of 25 in the United States with a correlation coefficient (R) of -0.053 and weighted average of 14.6%. Similarly, the statistical analysis conducted on geographies consisting of 429,272,443 people shows a very strong positive correlation between the proportion of Canadians and unemployment rate among youth under the age of 25 in the United States with a correlation coefficient (R) of 0.813 and weighted average of 11.4%, a difference of 28.5%.
Unemployment Among Youth under 25 years Correlation Summary
| Measurement | Trinidadian and Tobagonian | Canadian |
| Minimum | 2.9% | 5.0% |
| Maximum | 26.9% | 99.9% |
| Range | 24.0% | 94.9% |
| Mean | 15.7% | 26.0% |
| Median | 15.4% | 18.4% |
| Interquartile 25% (IQ1) | 13.2% | 13.0% |
| Interquartile 75% (IQ3) | 18.3% | 29.4% |
| Interquartile Range (IQR) | 5.1% | 16.5% |
| Standard Deviation (Sample) | 5.7% | 21.0% |
| Standard Deviation (Population) | 5.6% | 20.5% |
Similar Demographics by Unemployment Among Youth under 25 years
Demographics Similar to Trinidadians and Tobagonians by Unemployment Among Youth under 25 years
In terms of unemployment among youth under 25 years, the demographic groups most similar to Trinidadians and Tobagonians are Cheyenne (14.6%, a difference of 0.070%), Immigrants from Trinidad and Tobago (14.6%, a difference of 0.090%), Barbadian (14.6%, a difference of 0.23%), West Indian (14.6%, a difference of 0.27%), and Immigrants from Dominica (14.6%, a difference of 0.31%).
| Demographics | Rating | Rank | Unemployment Among Youth under 25 years |
| Sioux | 0.0 /100 | #315 | Tragic 14.4% |
| Natives/Alaskans | 0.0 /100 | #316 | Tragic 14.5% |
| Blacks/African Americans | 0.0 /100 | #317 | Tragic 14.5% |
| Immigrants | Dominica | 0.0 /100 | #318 | Tragic 14.6% |
| West Indians | 0.0 /100 | #319 | Tragic 14.6% |
| Barbadians | 0.0 /100 | #320 | Tragic 14.6% |
| Cheyenne | 0.0 /100 | #321 | Tragic 14.6% |
| Trinidadians and Tobagonians | 0.0 /100 | #322 | Tragic 14.6% |
| Immigrants | Trinidad and Tobago | 0.0 /100 | #323 | Tragic 14.6% |
| Immigrants | Jamaica | 0.0 /100 | #324 | Tragic 14.8% |
| Alaska Natives | 0.0 /100 | #325 | Tragic 14.9% |
| Immigrants | Barbados | 0.0 /100 | #326 | Tragic 15.2% |
| British West Indians | 0.0 /100 | #327 | Tragic 15.5% |
| Immigrants | Dominican Republic | 0.0 /100 | #328 | Tragic 15.6% |
| Immigrants | Yemen | 0.0 /100 | #329 | Tragic 15.6% |
Demographics Similar to Canadians by Unemployment Among Youth under 25 years
In terms of unemployment among youth under 25 years, the demographic groups most similar to Canadians are Greek (11.4%, a difference of 0.040%), Italian (11.4%, a difference of 0.050%), Immigrants from Argentina (11.4%, a difference of 0.050%), Immigrants from Hungary (11.4%, a difference of 0.050%), and Turkish (11.4%, a difference of 0.070%).
| Demographics | Rating | Rank | Unemployment Among Youth under 25 years |
| Immigrants | Scotland | 89.2 /100 | #119 | Excellent 11.4% |
| Malaysians | 89.0 /100 | #120 | Excellent 11.4% |
| Slovaks | 88.9 /100 | #121 | Excellent 11.4% |
| Immigrants | Micronesia | 88.1 /100 | #122 | Excellent 11.4% |
| Basques | 87.8 /100 | #123 | Excellent 11.4% |
| Italians | 87.2 /100 | #124 | Excellent 11.4% |
| Immigrants | Argentina | 87.2 /100 | #125 | Excellent 11.4% |
| Canadians | 86.6 /100 | #126 | Excellent 11.4% |
| Greeks | 86.2 /100 | #127 | Excellent 11.4% |
| Immigrants | Hungary | 86.0 /100 | #128 | Excellent 11.4% |
| Turks | 85.8 /100 | #129 | Excellent 11.4% |
| Hungarians | 85.7 /100 | #130 | Excellent 11.4% |
| Immigrants | Spain | 84.6 /100 | #131 | Excellent 11.4% |
| Ethiopians | 83.2 /100 | #132 | Excellent 11.4% |
| Lebanese | 83.1 /100 | #133 | Excellent 11.4% |