Trinidadian and Tobagonian vs British West Indian Unemployment
COMPARE
Trinidadian and Tobagonian
British West Indian
Unemployment
Unemployment Comparison
Trinidadians and Tobagonians
British West Indians
6.3%
UNEMPLOYMENT
0.0/ 100
METRIC RATING
301st/ 347
METRIC RANK
6.8%
UNEMPLOYMENT
0.0/ 100
METRIC RATING
319th/ 347
METRIC RANK
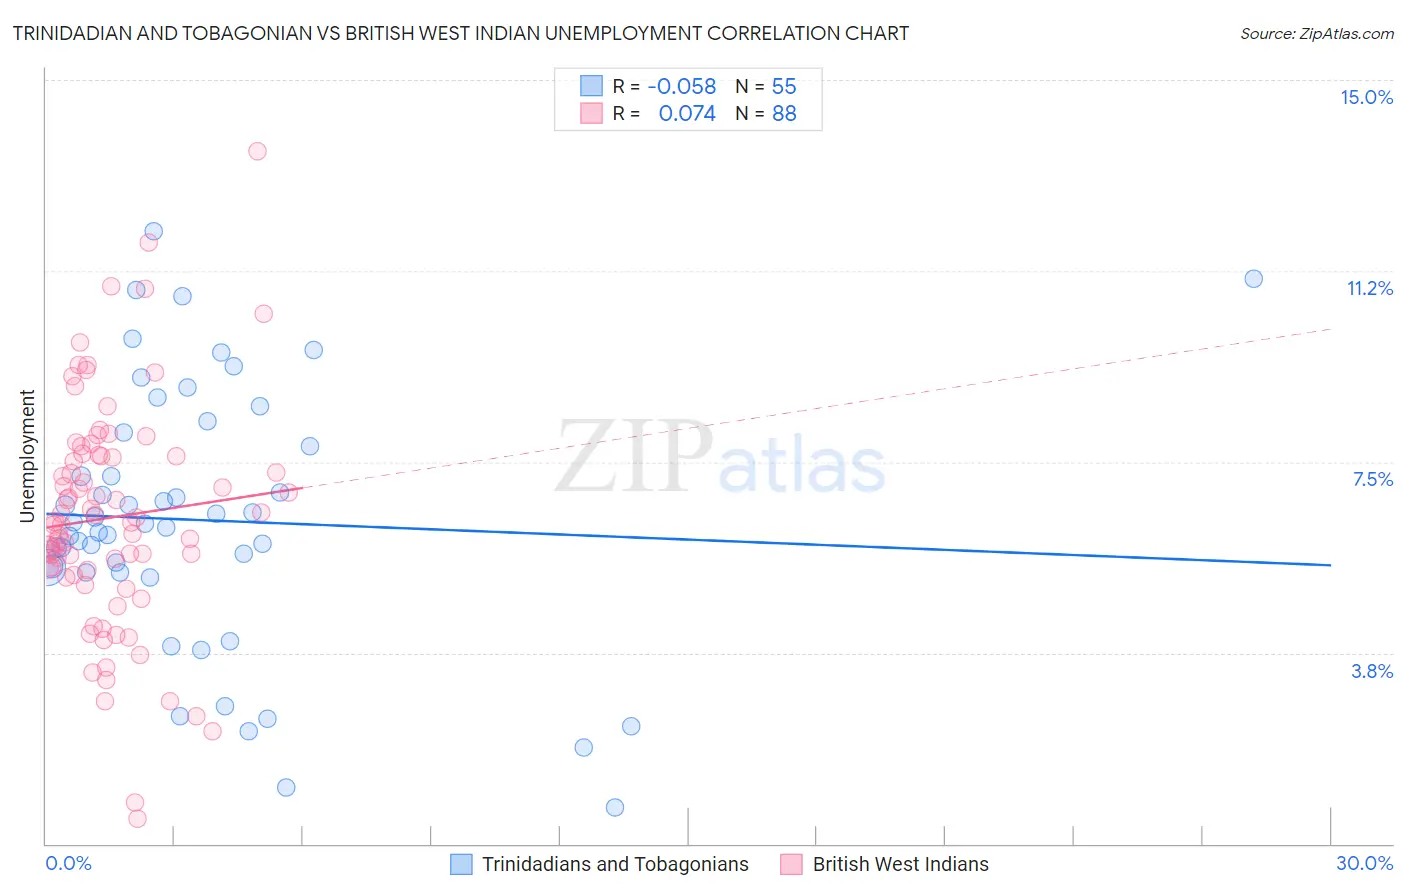
Trinidadian and Tobagonian vs British West Indian Unemployment Correlation Chart
The statistical analysis conducted on geographies consisting of 219,752,630 people shows a slight negative correlation between the proportion of Trinidadians and Tobagonians and unemployment in the United States with a correlation coefficient (R) of -0.058 and weighted average of 6.3%. Similarly, the statistical analysis conducted on geographies consisting of 152,665,255 people shows a slight positive correlation between the proportion of British West Indians and unemployment in the United States with a correlation coefficient (R) of 0.074 and weighted average of 6.8%, a difference of 7.7%.
Unemployment Correlation Summary
| Measurement | Trinidadian and Tobagonian | British West Indian |
| Minimum | 0.70% | 0.50% |
| Maximum | 12.0% | 13.6% |
| Range | 11.3% | 13.1% |
| Mean | 6.4% | 6.4% |
| Median | 6.3% | 6.3% |
| Interquartile 25% (IQ1) | 5.3% | 5.3% |
| Interquartile 75% (IQ3) | 8.1% | 7.6% |
| Interquartile Range (IQR) | 2.7% | 2.3% |
| Standard Deviation (Sample) | 2.6% | 2.3% |
| Standard Deviation (Population) | 2.6% | 2.3% |
Demographics Similar to Trinidadians and Tobagonians and British West Indians by Unemployment
In terms of unemployment, the demographic groups most similar to Trinidadians and Tobagonians are West Indian (6.4%, a difference of 0.25%), Immigrants from Trinidad and Tobago (6.3%, a difference of 0.48%), Belizean (6.4%, a difference of 0.48%), Immigrants from Jamaica (6.4%, a difference of 1.2%), and Menominee (6.4%, a difference of 1.4%). Similarly, the demographic groups most similar to British West Indians are Immigrants from Cabo Verde (6.8%, a difference of 0.21%), Immigrants from St. Vincent and the Grenadines (6.9%, a difference of 0.79%), Shoshone (6.8%, a difference of 0.81%), Immigrants from Dominica (6.7%, a difference of 1.4%), and Houma (6.7%, a difference of 2.2%).
| Demographics | Rating | Rank | Unemployment |
| Immigrants | Trinidad and Tobago | 0.0 /100 | #300 | Tragic 6.3% |
| Trinidadians and Tobagonians | 0.0 /100 | #301 | Tragic 6.3% |
| West Indians | 0.0 /100 | #302 | Tragic 6.4% |
| Belizeans | 0.0 /100 | #303 | Tragic 6.4% |
| Immigrants | Jamaica | 0.0 /100 | #304 | Tragic 6.4% |
| Menominee | 0.0 /100 | #305 | Tragic 6.4% |
| Lumbee | 0.0 /100 | #306 | Tragic 6.4% |
| Immigrants | Bangladesh | 0.0 /100 | #307 | Tragic 6.5% |
| Barbadians | 0.0 /100 | #308 | Tragic 6.5% |
| Vietnamese | 0.0 /100 | #309 | Tragic 6.5% |
| Immigrants | Belize | 0.0 /100 | #310 | Tragic 6.5% |
| Cape Verdeans | 0.0 /100 | #311 | Tragic 6.5% |
| Colville | 0.0 /100 | #312 | Tragic 6.6% |
| Immigrants | Barbados | 0.0 /100 | #313 | Tragic 6.6% |
| Blacks/African Americans | 0.0 /100 | #314 | Tragic 6.6% |
| Houma | 0.0 /100 | #315 | Tragic 6.7% |
| Immigrants | Dominica | 0.0 /100 | #316 | Tragic 6.7% |
| Shoshone | 0.0 /100 | #317 | Tragic 6.8% |
| Immigrants | Cabo Verde | 0.0 /100 | #318 | Tragic 6.8% |
| British West Indians | 0.0 /100 | #319 | Tragic 6.8% |
| Immigrants | St. Vincent and the Grenadines | 0.0 /100 | #320 | Tragic 6.9% |