Tlingit-Haida vs Scotch-Irish Unemployment Among Ages 65 to 74 years
COMPARE
Tlingit-Haida
Scotch-Irish
Unemployment Among Ages 65 to 74 years
Unemployment Among Ages 65 to 74 years Comparison
Tlingit-Haida
Scotch-Irish
6.5%
UNEMPLOYMENT AMONG AGES 65 TO 74 YEARS
0.0/ 100
METRIC RATING
338th/ 347
METRIC RANK
5.2%
UNEMPLOYMENT AMONG AGES 65 TO 74 YEARS
99.0/ 100
METRIC RATING
71st/ 347
METRIC RANK
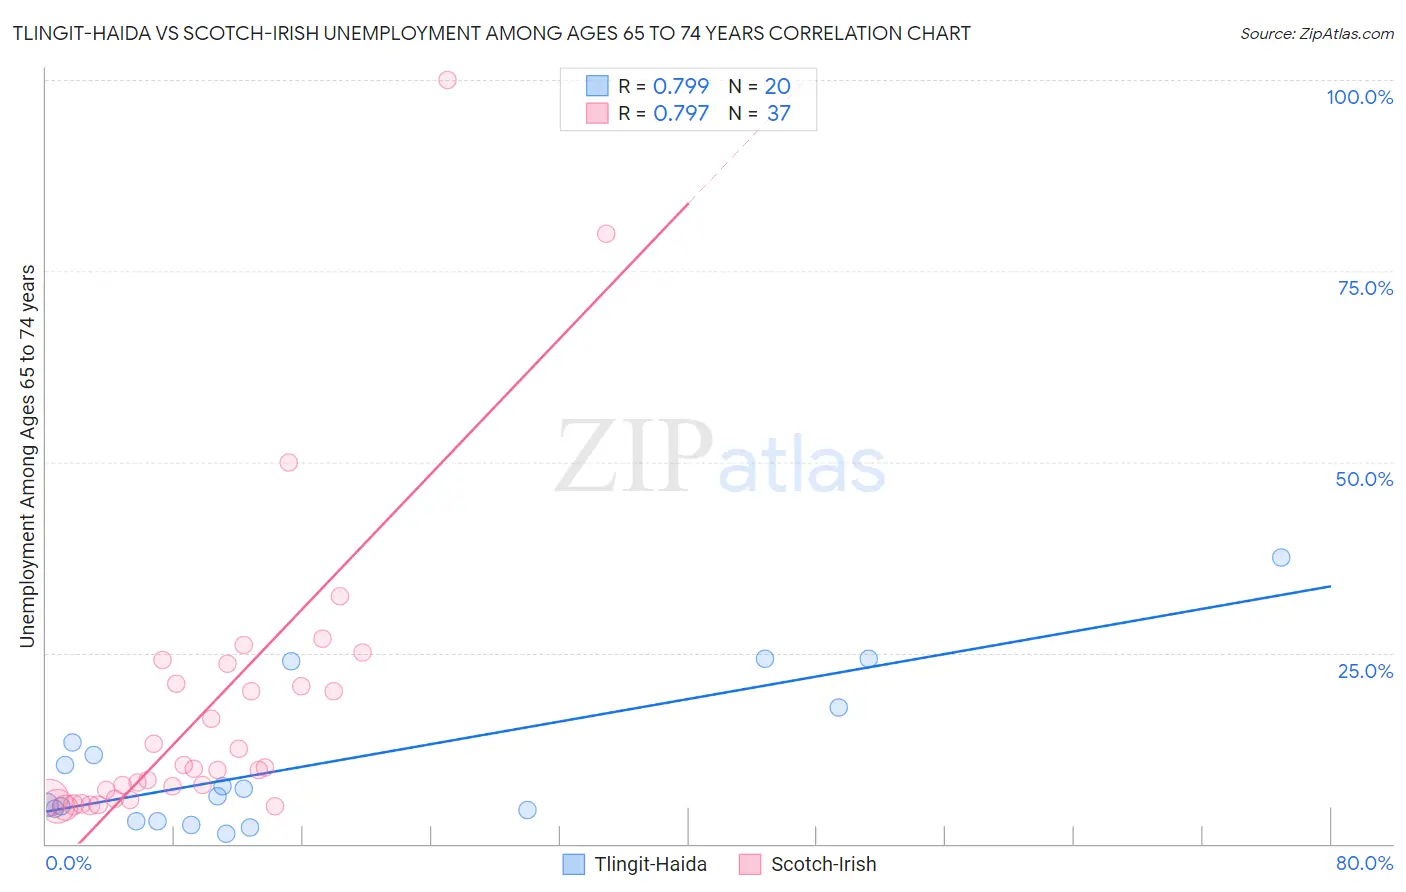
Tlingit-Haida vs Scotch-Irish Unemployment Among Ages 65 to 74 years Correlation Chart
The statistical analysis conducted on geographies consisting of 57,234,908 people shows a strong positive correlation between the proportion of Tlingit-Haida and unemployment rate among population between the ages 65 and 74 in the United States with a correlation coefficient (R) of 0.799 and weighted average of 6.5%. Similarly, the statistical analysis conducted on geographies consisting of 431,743,679 people shows a strong positive correlation between the proportion of Scotch-Irish and unemployment rate among population between the ages 65 and 74 in the United States with a correlation coefficient (R) of 0.797 and weighted average of 5.2%, a difference of 26.6%.
Unemployment Among Ages 65 to 74 years Correlation Summary
| Measurement | Tlingit-Haida | Scotch-Irish |
| Minimum | 1.3% | 4.7% |
| Maximum | 37.5% | 100.0% |
| Range | 36.2% | 95.3% |
| Mean | 10.7% | 17.8% |
| Median | 6.8% | 9.8% |
| Interquartile 25% (IQ1) | 3.7% | 6.0% |
| Interquartile 75% (IQ3) | 15.5% | 22.2% |
| Interquartile Range (IQR) | 11.8% | 16.3% |
| Standard Deviation (Sample) | 9.9% | 20.2% |
| Standard Deviation (Population) | 9.6% | 19.9% |
Similar Demographics by Unemployment Among Ages 65 to 74 years
Demographics Similar to Tlingit-Haida by Unemployment Among Ages 65 to 74 years
In terms of unemployment among ages 65 to 74 years, the demographic groups most similar to Tlingit-Haida are Ute (6.5%, a difference of 0.10%), Yakama (6.6%, a difference of 0.36%), Immigrants from Armenia (6.5%, a difference of 0.85%), Pima (6.6%, a difference of 1.2%), and Puerto Rican (6.4%, a difference of 2.5%).
| Demographics | Rating | Rank | Unemployment Among Ages 65 to 74 years |
| Bermudans | 0.0 /100 | #331 | Tragic 6.3% |
| Immigrants | Dominican Republic | 0.0 /100 | #332 | Tragic 6.3% |
| Paiute | 0.0 /100 | #333 | Tragic 6.3% |
| Taiwanese | 0.0 /100 | #334 | Tragic 6.3% |
| Puerto Ricans | 0.0 /100 | #335 | Tragic 6.4% |
| Immigrants | Armenia | 0.0 /100 | #336 | Tragic 6.5% |
| Ute | 0.0 /100 | #337 | Tragic 6.5% |
| Tlingit-Haida | 0.0 /100 | #338 | Tragic 6.5% |
| Yakama | 0.0 /100 | #339 | Tragic 6.6% |
| Pima | 0.0 /100 | #340 | Tragic 6.6% |
| Alaska Natives | 0.0 /100 | #341 | Tragic 6.8% |
| Navajo | 0.0 /100 | #342 | Tragic 6.9% |
| Alaskan Athabascans | 0.0 /100 | #343 | Tragic 7.4% |
| Inupiat | 0.0 /100 | #344 | Tragic 7.5% |
| Immigrants | Yemen | 0.0 /100 | #345 | Tragic 8.3% |
Demographics Similar to Scotch-Irish by Unemployment Among Ages 65 to 74 years
In terms of unemployment among ages 65 to 74 years, the demographic groups most similar to Scotch-Irish are Immigrants from Oceania (5.2%, a difference of 0.010%), Filipino (5.2%, a difference of 0.030%), Afghan (5.2%, a difference of 0.040%), Okinawan (5.2%, a difference of 0.050%), and Estonian (5.2%, a difference of 0.050%).
| Demographics | Rating | Rank | Unemployment Among Ages 65 to 74 years |
| Immigrants | Moldova | 99.3 /100 | #64 | Exceptional 5.1% |
| Bolivians | 99.3 /100 | #65 | Exceptional 5.1% |
| Iroquois | 99.3 /100 | #66 | Exceptional 5.1% |
| Swiss | 99.2 /100 | #67 | Exceptional 5.1% |
| Latvians | 99.2 /100 | #68 | Exceptional 5.1% |
| Scandinavians | 99.1 /100 | #69 | Exceptional 5.2% |
| Immigrants | Japan | 99.1 /100 | #70 | Exceptional 5.2% |
| Scotch-Irish | 99.0 /100 | #71 | Exceptional 5.2% |
| Immigrants | Oceania | 99.0 /100 | #72 | Exceptional 5.2% |
| Filipinos | 99.0 /100 | #73 | Exceptional 5.2% |
| Afghans | 99.0 /100 | #74 | Exceptional 5.2% |
| Okinawans | 99.0 /100 | #75 | Exceptional 5.2% |
| Estonians | 99.0 /100 | #76 | Exceptional 5.2% |
| Immigrants | Sudan | 98.9 /100 | #77 | Exceptional 5.2% |
| Northern Europeans | 98.9 /100 | #78 | Exceptional 5.2% |