Tlingit-Haida vs Ecuadorian Unemployment Among Ages 55 to 59 years
COMPARE
Tlingit-Haida
Ecuadorian
Unemployment Among Ages 55 to 59 years
Unemployment Among Ages 55 to 59 years Comparison
Tlingit-Haida
Ecuadorians
5.7%
UNEMPLOYMENT AMONG AGES 55 TO 59 YEARS
0.0/ 100
METRIC RATING
314th/ 347
METRIC RANK
5.6%
UNEMPLOYMENT AMONG AGES 55 TO 59 YEARS
0.0/ 100
METRIC RATING
312th/ 347
METRIC RANK
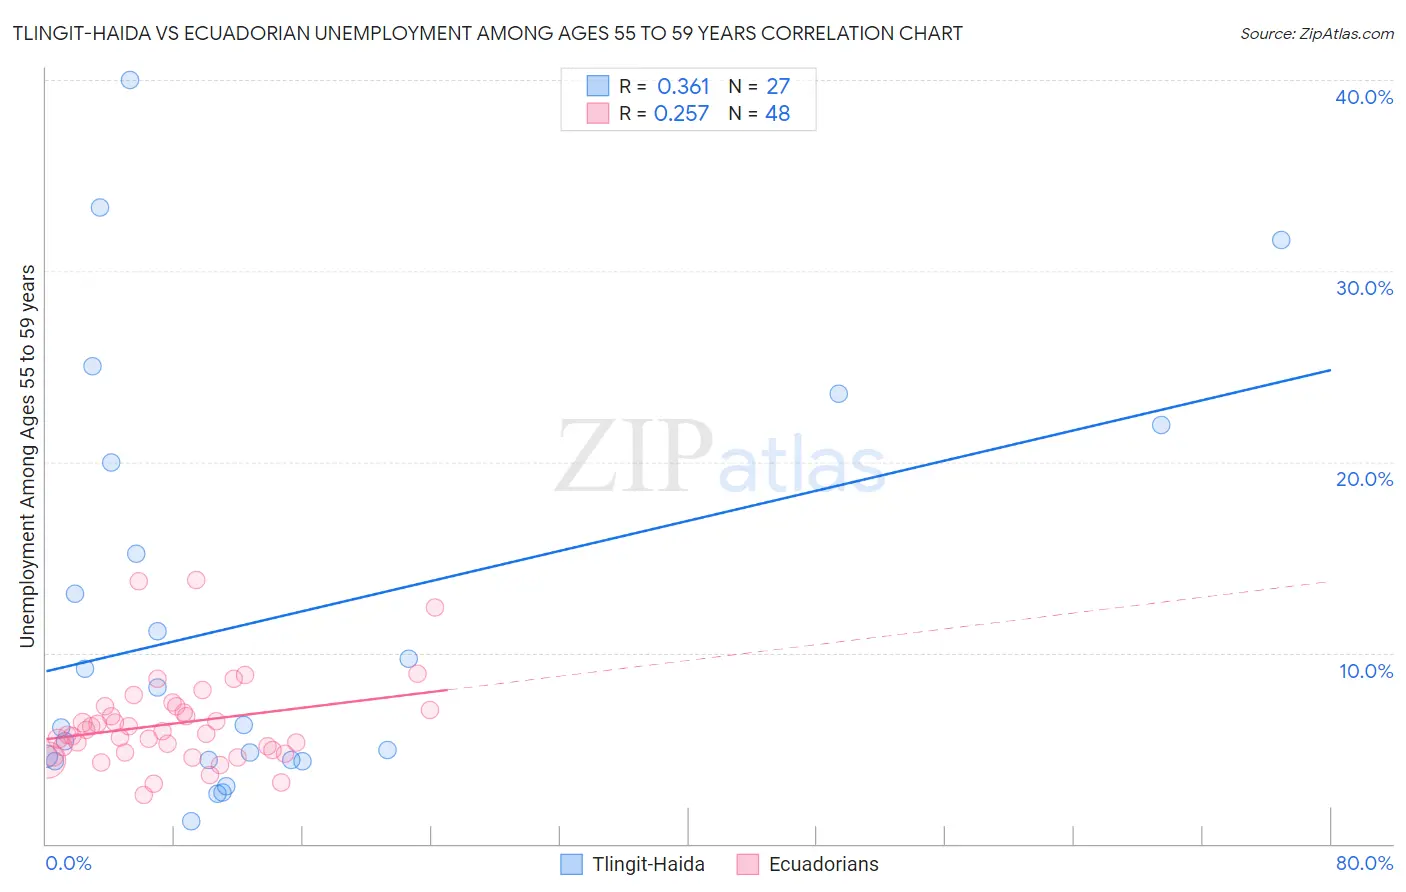
Tlingit-Haida vs Ecuadorian Unemployment Among Ages 55 to 59 years Correlation Chart
The statistical analysis conducted on geographies consisting of 58,839,053 people shows a mild positive correlation between the proportion of Tlingit-Haida and unemployment rate among population between the ages 55 and 59 in the United States with a correlation coefficient (R) of 0.361 and weighted average of 5.7%. Similarly, the statistical analysis conducted on geographies consisting of 302,298,527 people shows a weak positive correlation between the proportion of Ecuadorians and unemployment rate among population between the ages 55 and 59 in the United States with a correlation coefficient (R) of 0.257 and weighted average of 5.6%, a difference of 0.48%.
Unemployment Among Ages 55 to 59 years Correlation Summary
| Measurement | Tlingit-Haida | Ecuadorian |
| Minimum | 1.2% | 2.5% |
| Maximum | 40.0% | 13.8% |
| Range | 38.8% | 11.3% |
| Mean | 11.9% | 6.3% |
| Median | 6.2% | 5.8% |
| Interquartile 25% (IQ1) | 4.4% | 4.8% |
| Interquartile 75% (IQ3) | 20.0% | 7.1% |
| Interquartile Range (IQR) | 15.6% | 2.3% |
| Standard Deviation (Sample) | 10.7% | 2.4% |
| Standard Deviation (Population) | 10.5% | 2.3% |
Demographics Similar to Tlingit-Haida and Ecuadorians by Unemployment Among Ages 55 to 59 years
In terms of unemployment among ages 55 to 59 years, the demographic groups most similar to Tlingit-Haida are Guyanese (5.7%, a difference of 0.15%), Central American Indian (5.6%, a difference of 0.29%), Immigrants from Ecuador (5.7%, a difference of 0.34%), Hmong (5.7%, a difference of 0.57%), and Houma (5.6%, a difference of 0.69%). Similarly, the demographic groups most similar to Ecuadorians are Central American Indian (5.6%, a difference of 0.19%), Houma (5.6%, a difference of 0.21%), Belizean (5.6%, a difference of 0.39%), Guyanese (5.7%, a difference of 0.63%), and Immigrants from Ecuador (5.7%, a difference of 0.82%).
| Demographics | Rating | Rank | Unemployment Among Ages 55 to 59 years |
| Marshallese | 0.0 /100 | #303 | Tragic 5.5% |
| Blacks/African Americans | 0.0 /100 | #304 | Tragic 5.5% |
| Immigrants | Portugal | 0.0 /100 | #305 | Tragic 5.5% |
| Immigrants | Cabo Verde | 0.0 /100 | #306 | Tragic 5.5% |
| Immigrants | Belize | 0.0 /100 | #307 | Tragic 5.5% |
| Spanish American Indians | 0.0 /100 | #308 | Tragic 5.6% |
| Nepalese | 0.0 /100 | #309 | Tragic 5.6% |
| Belizeans | 0.0 /100 | #310 | Tragic 5.6% |
| Houma | 0.0 /100 | #311 | Tragic 5.6% |
| Ecuadorians | 0.0 /100 | #312 | Tragic 5.6% |
| Central American Indians | 0.0 /100 | #313 | Tragic 5.6% |
| Tlingit-Haida | 0.0 /100 | #314 | Tragic 5.7% |
| Guyanese | 0.0 /100 | #315 | Tragic 5.7% |
| Immigrants | Ecuador | 0.0 /100 | #316 | Tragic 5.7% |
| Hmong | 0.0 /100 | #317 | Tragic 5.7% |
| Immigrants | Guyana | 0.0 /100 | #318 | Tragic 5.8% |
| Kiowa | 0.0 /100 | #319 | Tragic 5.8% |
| Immigrants | Azores | 0.0 /100 | #320 | Tragic 5.8% |
| Chippewa | 0.0 /100 | #321 | Tragic 5.9% |
| Crow | 0.0 /100 | #322 | Tragic 5.9% |
| Immigrants | Bangladesh | 0.0 /100 | #323 | Tragic 5.9% |