Thai vs Guatemalan Unemployment Among Seniors over 75 years
COMPARE
Thai
Guatemalan
Unemployment Among Seniors over 75 years
Unemployment Among Seniors over 75 years Comparison
Thais
Guatemalans
8.3%
UNEMPLOYMENT AMONG SENIORS OVER 75 YEARS
96.8/ 100
METRIC RATING
124th/ 347
METRIC RANK
8.8%
UNEMPLOYMENT AMONG SENIORS OVER 75 YEARS
39.5/ 100
METRIC RATING
182nd/ 347
METRIC RANK
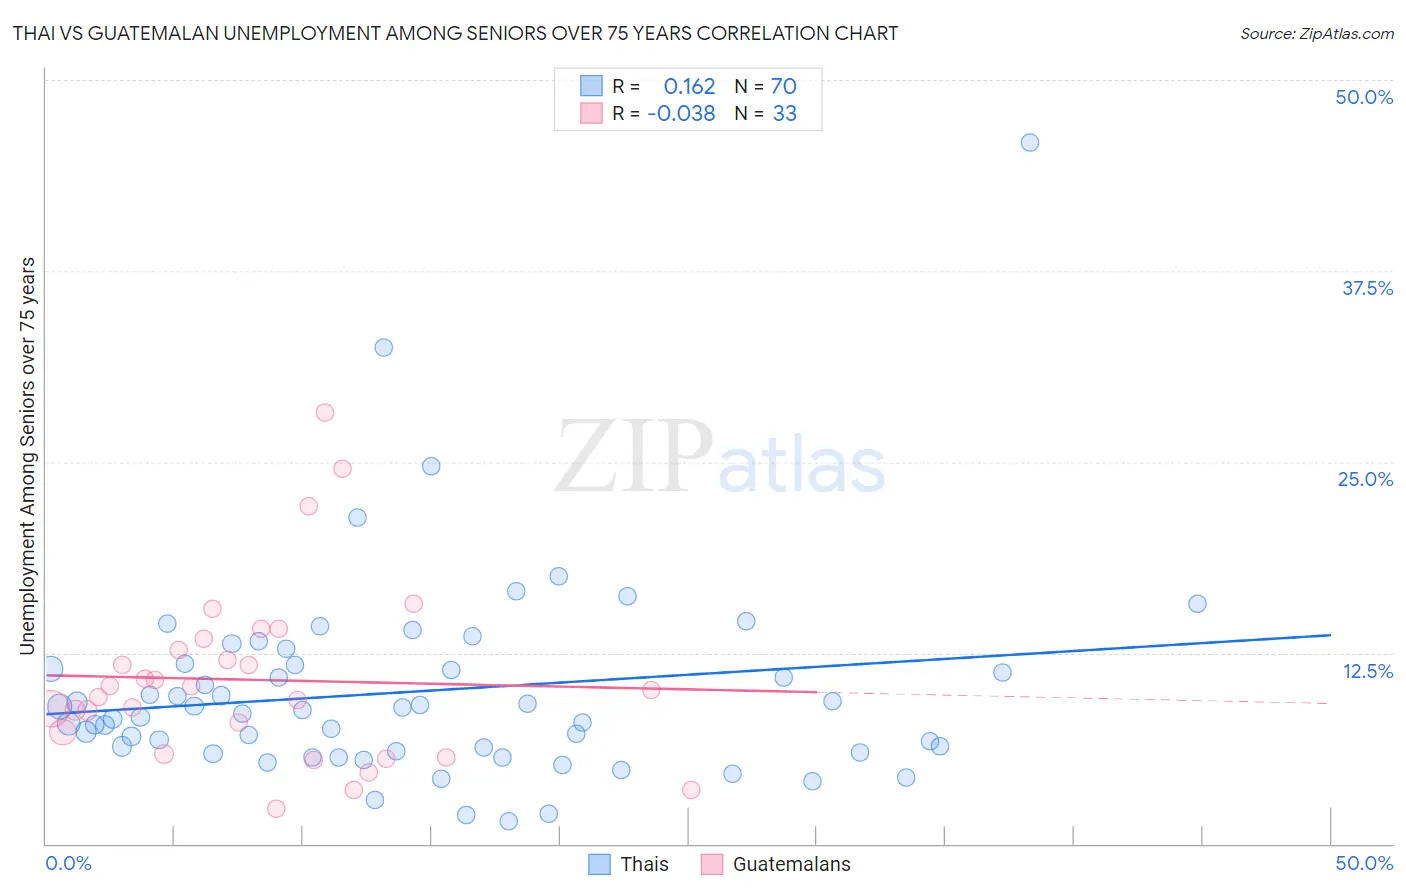
Thai vs Guatemalan Unemployment Among Seniors over 75 years Correlation Chart
The statistical analysis conducted on geographies consisting of 223,012,575 people shows a poor positive correlation between the proportion of Thais and unemployment rate among seniors over the age of 75 in the United States with a correlation coefficient (R) of 0.162 and weighted average of 8.3%. Similarly, the statistical analysis conducted on geographies consisting of 204,244,700 people shows no correlation between the proportion of Guatemalans and unemployment rate among seniors over the age of 75 in the United States with a correlation coefficient (R) of -0.038 and weighted average of 8.8%, a difference of 5.4%.
Unemployment Among Seniors over 75 years Correlation Summary
| Measurement | Thai | Guatemalan |
| Minimum | 1.5% | 2.3% |
| Maximum | 45.9% | 28.2% |
| Range | 44.4% | 25.9% |
| Mean | 10.0% | 10.7% |
| Median | 8.6% | 10.1% |
| Interquartile 25% (IQ1) | 6.0% | 6.6% |
| Interquartile 75% (IQ3) | 11.7% | 13.1% |
| Interquartile Range (IQR) | 5.7% | 6.5% |
| Standard Deviation (Sample) | 6.8% | 5.8% |
| Standard Deviation (Population) | 6.7% | 5.7% |
Similar Demographics by Unemployment Among Seniors over 75 years
Demographics Similar to Thais by Unemployment Among Seniors over 75 years
In terms of unemployment among seniors over 75 years, the demographic groups most similar to Thais are Immigrants from Moldova (8.3%, a difference of 0.020%), Immigrants from Nepal (8.3%, a difference of 0.040%), Immigrants from Russia (8.3%, a difference of 0.12%), Immigrants from Croatia (8.3%, a difference of 0.19%), and Belizean (8.4%, a difference of 0.22%).
| Demographics | Rating | Rank | Unemployment Among Seniors over 75 years |
| Immigrants | Greece | 97.9 /100 | #117 | Exceptional 8.3% |
| Immigrants | Middle Africa | 97.9 /100 | #118 | Exceptional 8.3% |
| Japanese | 97.5 /100 | #119 | Exceptional 8.3% |
| Immigrants | Asia | 97.4 /100 | #120 | Exceptional 8.3% |
| Immigrants | Croatia | 97.2 /100 | #121 | Exceptional 8.3% |
| Immigrants | Russia | 97.1 /100 | #122 | Exceptional 8.3% |
| Immigrants | Nepal | 96.9 /100 | #123 | Exceptional 8.3% |
| Thais | 96.8 /100 | #124 | Exceptional 8.3% |
| Immigrants | Moldova | 96.7 /100 | #125 | Exceptional 8.3% |
| Belizeans | 96.3 /100 | #126 | Exceptional 8.4% |
| Hondurans | 96.2 /100 | #127 | Exceptional 8.4% |
| Native Hawaiians | 96.1 /100 | #128 | Exceptional 8.4% |
| Ghanaians | 96.0 /100 | #129 | Exceptional 8.4% |
| Apache | 95.2 /100 | #130 | Exceptional 8.4% |
| German Russians | 94.9 /100 | #131 | Exceptional 8.4% |
Demographics Similar to Guatemalans by Unemployment Among Seniors over 75 years
In terms of unemployment among seniors over 75 years, the demographic groups most similar to Guatemalans are Immigrants from Thailand (8.8%, a difference of 0.040%), Immigrants from Afghanistan (8.8%, a difference of 0.070%), Immigrants from Italy (8.8%, a difference of 0.12%), Immigrants from Somalia (8.8%, a difference of 0.12%), and West Indian (8.8%, a difference of 0.13%).
| Demographics | Rating | Rank | Unemployment Among Seniors over 75 years |
| Syrians | 49.6 /100 | #175 | Average 8.7% |
| Somalis | 45.3 /100 | #176 | Average 8.8% |
| Central Americans | 43.3 /100 | #177 | Average 8.8% |
| West Indians | 41.9 /100 | #178 | Average 8.8% |
| Immigrants | Italy | 41.7 /100 | #179 | Average 8.8% |
| Immigrants | Somalia | 41.7 /100 | #180 | Average 8.8% |
| Immigrants | Thailand | 40.2 /100 | #181 | Average 8.8% |
| Guatemalans | 39.5 /100 | #182 | Fair 8.8% |
| Immigrants | Afghanistan | 38.2 /100 | #183 | Fair 8.8% |
| Immigrants | Micronesia | 37.2 /100 | #184 | Fair 8.8% |
| Choctaw | 37.1 /100 | #185 | Fair 8.8% |
| Immigrants | Ethiopia | 36.2 /100 | #186 | Fair 8.8% |
| Immigrants | Europe | 35.2 /100 | #187 | Fair 8.8% |
| Immigrants | Eastern Europe | 34.7 /100 | #188 | Fair 8.8% |
| Immigrants | Haiti | 34.7 /100 | #189 | Fair 8.8% |