Taiwanese vs Immigrants from Somalia Unemployment Among Ages 20 to 24 years
COMPARE
Taiwanese
Immigrants from Somalia
Unemployment Among Ages 20 to 24 years
Unemployment Among Ages 20 to 24 years Comparison
Taiwanese
Immigrants from Somalia
9.4%
UNEMPLOYMENT AMONG AGES 20 TO 24 YEARS
100.0/ 100
METRIC RATING
24th/ 347
METRIC RANK
9.2%
UNEMPLOYMENT AMONG AGES 20 TO 24 YEARS
100.0/ 100
METRIC RATING
9th/ 347
METRIC RANK
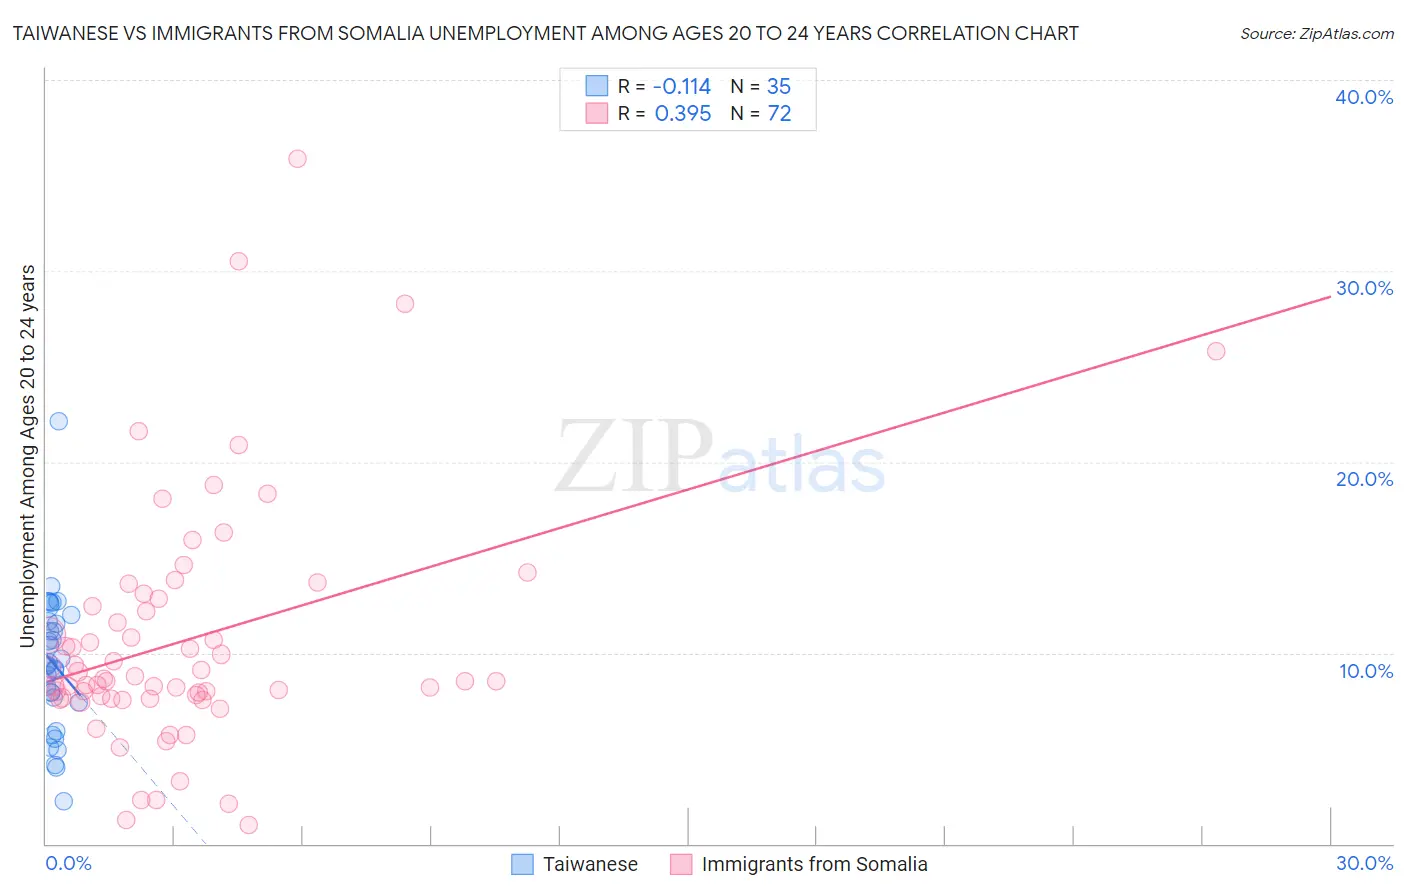
Taiwanese vs Immigrants from Somalia Unemployment Among Ages 20 to 24 years Correlation Chart
The statistical analysis conducted on geographies consisting of 31,679,068 people shows a poor negative correlation between the proportion of Taiwanese and unemployment rate among population between the ages 20 and 24 in the United States with a correlation coefficient (R) of -0.114 and weighted average of 9.4%. Similarly, the statistical analysis conducted on geographies consisting of 91,711,849 people shows a mild positive correlation between the proportion of Immigrants from Somalia and unemployment rate among population between the ages 20 and 24 in the United States with a correlation coefficient (R) of 0.395 and weighted average of 9.2%, a difference of 3.1%.
Unemployment Among Ages 20 to 24 years Correlation Summary
| Measurement | Taiwanese | Immigrants from Somalia |
| Minimum | 2.2% | 1.0% |
| Maximum | 22.1% | 35.9% |
| Range | 19.9% | 34.9% |
| Mean | 9.4% | 10.7% |
| Median | 9.4% | 8.6% |
| Interquartile 25% (IQ1) | 7.4% | 7.6% |
| Interquartile 75% (IQ3) | 11.7% | 12.6% |
| Interquartile Range (IQR) | 4.3% | 5.0% |
| Standard Deviation (Sample) | 3.7% | 6.4% |
| Standard Deviation (Population) | 3.6% | 6.3% |
Demographics Similar to Taiwanese and Immigrants from Somalia by Unemployment Among Ages 20 to 24 years
In terms of unemployment among ages 20 to 24 years, the demographic groups most similar to Taiwanese are Immigrants from Eritrea (9.5%, a difference of 0.25%), Swedish (9.5%, a difference of 0.25%), Tongan (9.4%, a difference of 0.31%), Immigrants from Nepal (9.4%, a difference of 0.31%), and Immigrants from Bosnia and Herzegovina (9.4%, a difference of 0.58%). Similarly, the demographic groups most similar to Immigrants from Somalia are Sudanese (9.2%, a difference of 0.21%), Somali (9.1%, a difference of 0.35%), Luxembourger (9.1%, a difference of 0.37%), Zimbabwean (9.2%, a difference of 0.66%), and Immigrants from Burma/Myanmar (9.1%, a difference of 0.73%).
| Demographics | Rating | Rank | Unemployment Among Ages 20 to 24 years |
| Immigrants | Burma/Myanmar | 100.0 /100 | #6 | Exceptional 9.1% |
| Luxembourgers | 100.0 /100 | #7 | Exceptional 9.1% |
| Somalis | 100.0 /100 | #8 | Exceptional 9.1% |
| Immigrants | Somalia | 100.0 /100 | #9 | Exceptional 9.2% |
| Sudanese | 100.0 /100 | #10 | Exceptional 9.2% |
| Zimbabweans | 100.0 /100 | #11 | Exceptional 9.2% |
| Cubans | 100.0 /100 | #12 | Exceptional 9.2% |
| Immigrants | Congo | 100.0 /100 | #13 | Exceptional 9.2% |
| Slovenes | 100.0 /100 | #14 | Exceptional 9.3% |
| Immigrants | Sudan | 100.0 /100 | #15 | Exceptional 9.3% |
| Danes | 100.0 /100 | #16 | Exceptional 9.3% |
| Czechs | 100.0 /100 | #17 | Exceptional 9.3% |
| Chinese | 100.0 /100 | #18 | Exceptional 9.4% |
| Hmong | 100.0 /100 | #19 | Exceptional 9.4% |
| Osage | 100.0 /100 | #20 | Exceptional 9.4% |
| Immigrants | Bosnia and Herzegovina | 100.0 /100 | #21 | Exceptional 9.4% |
| Tongans | 100.0 /100 | #22 | Exceptional 9.4% |
| Immigrants | Nepal | 100.0 /100 | #23 | Exceptional 9.4% |
| Taiwanese | 100.0 /100 | #24 | Exceptional 9.4% |
| Immigrants | Eritrea | 100.0 /100 | #25 | Exceptional 9.5% |
| Swedes | 100.0 /100 | #26 | Exceptional 9.5% |