Swedish vs Immigrants from Czechoslovakia Unemployment

COMPARE

Swedish
Race
Ancestry
AfghanAfricanAlaska NativeAlaskan AthabascanAlbanianAleutAlsatianAmericanApacheArabArapahoArgentineanArmenianAssyrian/Chaldean/SyriacAustralianAustrianBahamianBangladeshiBarbadianBasqueBelgianBelizeanBermudanBhutaneseBlackfeetBolivianBrazilianBritishBritish West IndianBulgarianBurmeseCajunCambodianCanadianCape VerdeanCarpatho RusynCelticCentral AmericanCentral American IndianCherokeeCheyenneChickasawChileanChineseChippewaChoctawColombianColvilleComancheCosta RicanCreeCreekCroatianCrowCubanCypriotCzechCzechoslovakianDanishDelawareDominicanDutchDutch West IndianEastern EuropeanEcuadorianEgyptianEnglishEstonianEthiopianEuropeanFijianFilipinoFinnishFrenchFrench American IndianFrench CanadianGermanGerman RussianGhanaianGreekGuamanian/ChamorroGuatemalanGuyaneseHaitianHmongHonduranHopiHoumaHungarianIcelanderIndian (Asian)IndonesianInupiatIranianIraqiIrishIroquoisIsraeliItalianJamaicanJapaneseJordanianKenyanKiowaKoreanLaotianLatvianLebaneseLiberianLithuanianLumbeeLuxembourgerMacedonianMalaysianMalteseMarshalleseMenomineeMexicanMexican American IndianMongolianMoroccanNative HawaiianNavajoNepaleseNew ZealanderNicaraguanNigerianNorthern EuropeanNorwegianOkinawanOsageOttawaPaiutePakistaniPalestinianPanamanianParaguayanPennsylvania GermanPeruvianPimaPolishPortuguesePotawatomiPuebloPuerto RicanPuget Sound SalishRomanianRussianSalvadoranSamoanScandinavianScotch-IrishScottishSeminoleSenegaleseSerbianShoshoneSierra LeoneanSiouxSlavicSlovakSloveneSomaliSouth AfricanSouth AmericanSouth American IndianSoviet UnionSpaniardSpanishSpanish AmericanSpanish American IndianSri LankanSubsaharan AfricanSudaneseSwedishSwissSyrianTaiwaneseThaiTlingit-HaidaTohono O'OdhamTonganTrinidadian and TobagonianTsimshianTurkishU.S. Virgin IslanderUgandanUkrainianUruguayanUteVenezuelanVietnameseWelshWest IndianYakamaYaquiYugoslavianYumanYup'ikZimbabwean
Immigration
NonimmigrantsImmigrantsAfghanistanAfricaAlbaniaArgentinaArmeniaAsiaAustraliaAustriaBahamasBangladeshBarbadosBelarusBelgiumBelizeBoliviaBosnia and HerzegovinaBrazilBulgariaBurma/MyanmarCabo VerdeCambodiaCameroonCanadaCaribbeanCentral AmericaChileChinaColombiaCongoCosta RicaCroatiaCubaDenmarkDominicaDominican RepublicEastern AfricaEastern AsiaEastern EuropeEcuadorEgyptEl SalvadorEnglandEritreaEthiopiaEuropeFijiFranceGermanyGhanaGreeceGrenadaGuatemalaGuyanaHaitiHondurasHong KongHungaryIndiaIndonesiaIranIraqIrelandIsraelItalyJamaicaJapanJordanKazakhstanKenyaKoreaKuwaitLaosLatin AmericaLatviaLebanonLiberiaLithuaniaMalaysiaMexicoMicronesiaMiddle AfricaMoldovaMoroccoNepalNetherlandsNicaraguaNigeriaNorth AmericaNorth MacedoniaNorthern AfricaNorthern EuropeNorwayOceaniaPakistanPanamaPeruPhilippinesPolandPortugalRomaniaRussiaSaudi ArabiaScotlandSenegalSerbiaSierra LeoneSingaporeSomaliaSouth AfricaSouth AmericaSouth Central AsiaSouth Eastern AsiaSouthern EuropeSpainSri LankaSt. Vincent and the GrenadinesSudanSwedenSwitzerlandSyriaTaiwanThailandTrinidad and TobagoTurkeyUgandaUkraineUruguayUzbekistanVenezuelaVietnamWest IndiesWestern AfricaWestern AsiaWestern EuropeYemenZaireZimbabweAzores
Immigrants from Czechoslovakia
Race
Ancestry
AfghanAfricanAlaska NativeAlaskan AthabascanAlbanianAleutAlsatianAmericanApacheArabArapahoArgentineanArmenianAssyrian/Chaldean/SyriacAustralianAustrianBahamianBangladeshiBarbadianBasqueBelgianBelizeanBermudanBhutaneseBlackfeetBolivianBrazilianBritishBritish West IndianBulgarianBurmeseCajunCambodianCanadianCape VerdeanCarpatho RusynCelticCentral AmericanCentral American IndianCherokeeCheyenneChickasawChileanChineseChippewaChoctawColombianColvilleComancheCosta RicanCreeCreekCroatianCrowCubanCypriotCzechCzechoslovakianDanishDelawareDominicanDutchDutch West IndianEastern EuropeanEcuadorianEgyptianEnglishEstonianEthiopianEuropeanFijianFilipinoFinnishFrenchFrench American IndianFrench CanadianGermanGerman RussianGhanaianGreekGuamanian/ChamorroGuatemalanGuyaneseHaitianHmongHonduranHopiHoumaHungarianIcelanderIndian (Asian)IndonesianInupiatIranianIraqiIrishIroquoisIsraeliItalianJamaicanJapaneseJordanianKenyanKiowaKoreanLaotianLatvianLebaneseLiberianLithuanianLumbeeLuxembourgerMacedonianMalaysianMalteseMarshalleseMenomineeMexicanMexican American IndianMongolianMoroccanNative HawaiianNavajoNepaleseNew ZealanderNicaraguanNigerianNorthern EuropeanNorwegianOkinawanOsageOttawaPaiutePakistaniPalestinianPanamanianParaguayanPennsylvania GermanPeruvianPimaPolishPortuguesePotawatomiPuebloPuerto RicanPuget Sound SalishRomanianRussianSalvadoranSamoanScandinavianScotch-IrishScottishSeminoleSenegaleseSerbianShoshoneSierra LeoneanSiouxSlavicSlovakSloveneSomaliSouth AfricanSouth AmericanSouth American IndianSoviet UnionSpaniardSpanishSpanish AmericanSpanish American IndianSri LankanSubsaharan AfricanSudaneseSwissSyrianTaiwaneseThaiTlingit-HaidaTohono O'OdhamTonganTrinidadian and TobagonianTsimshianTurkishU.S. Virgin IslanderUgandanUkrainianUruguayanUteVenezuelanVietnameseWelshWest IndianYakamaYaquiYugoslavianYumanYup'ikZimbabwean
Immigration
NonimmigrantsImmigrantsAfghanistanAfricaAlbaniaArgentinaArmeniaAsiaAustraliaAustriaBahamasBangladeshBarbadosBelarusBelgiumBelizeBoliviaBosnia and HerzegovinaBrazilBulgariaBurma/MyanmarCabo VerdeCambodiaCameroonCanadaCaribbeanCentral AmericaChileChinaColombiaCongoCosta RicaCroatiaCubaCzechoslovakiaDenmarkDominicaDominican RepublicEastern AfricaEastern AsiaEastern EuropeEcuadorEgyptEl SalvadorEnglandEritreaEthiopiaEuropeFijiFranceGermanyGhanaGreeceGrenadaGuatemalaGuyanaHaitiHondurasHong KongHungaryIndiaIndonesiaIranIraqIrelandIsraelItalyJamaicaJapanJordanKazakhstanKenyaKoreaKuwaitLaosLatin AmericaLatviaLebanonLiberiaLithuaniaMalaysiaMexicoMicronesiaMiddle AfricaMoldovaMoroccoNepalNetherlandsNicaraguaNigeriaNorth AmericaNorth MacedoniaNorthern AfricaNorthern EuropeNorwayOceaniaPakistanPanamaPeruPhilippinesPolandPortugalRomaniaRussiaSaudi ArabiaScotlandSenegalSerbiaSierra LeoneSingaporeSomaliaSouth AfricaSouth AmericaSouth Central AsiaSouth Eastern AsiaSouthern EuropeSpainSri LankaSt. Vincent and the GrenadinesSudanSwedenSwitzerlandSyriaTaiwanThailandTrinidad and TobagoTurkeyUgandaUkraineUruguayUzbekistanVenezuelaVietnamWest IndiesWestern AfricaWestern AsiaWestern EuropeYemenZaireZimbabweAzores
Unemployment
Income
Poverty
Unemployment
Labor Participation
Family Structure
Vehicle Availability
Education Level
Disability

Unemployment Comparison

Swedes

Immigrants from Czechoslovakia

Exceptional
Exceptional
4.4%
UNEMPLOYMENT
100.0/ 100
METRIC RATING
5th/ 347
METRIC RANK
5.0%
UNEMPLOYMENT
95.1/ 100
METRIC RATING
97th/ 347
METRIC RANK

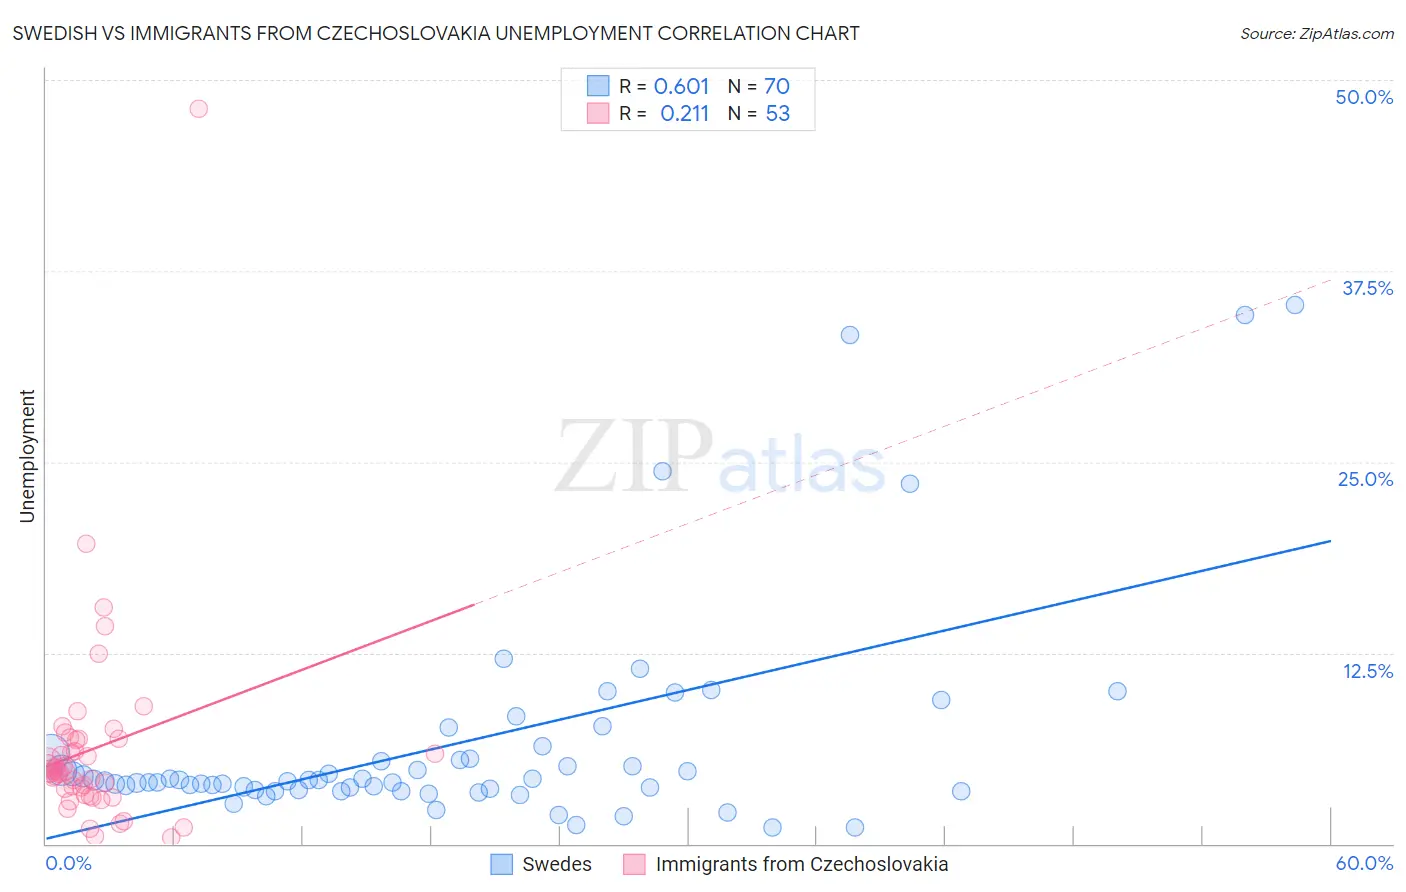
Swedish vs Immigrants from Czechoslovakia Unemployment Correlation Chart

The statistical analysis conducted on geographies consisting of 536,260,652 people shows a significant positive correlation between the proportion of Swedes and unemployment in the United States with a correlation coefficient (R) of 0.601 and weighted average of 4.4%. Similarly, the statistical analysis conducted on geographies consisting of 195,397,412 people shows a weak positive correlation between the proportion of Immigrants from Czechoslovakia and unemployment in the United States with a correlation coefficient (R) of 0.211 and weighted average of 5.0%, a difference of 12.8%.
Swedish vs Immigrants from Czechoslovakia Unemployment

Unemployment Correlation Summary

MeasurementSwedishImmigrants from Czechoslovakia
Minimum1.1%0.40%
Maximum35.3%48.1%
Range34.2%47.7%
Mean6.5%6.2%
Median4.1%4.7%
Interquartile 25% (IQ1)3.5%3.4%
Interquartile 75% (IQ3)5.6%6.9%
Interquartile Range (IQR)2.0%3.5%
Standard Deviation (Sample)7.2%6.9%
Standard Deviation (Population)7.1%6.8%

Similar Demographics by Unemployment

Demographics Similar to Swedes by Unemployment

In terms of unemployment, the demographic groups most similar to Swedes are German (4.5%, a difference of 0.79%), Immigrants from India (4.5%, a difference of 1.3%), Swiss (4.5%, a difference of 1.8%), Scandinavian (4.5%, a difference of 2.2%), and Danish (4.3%, a difference of 2.3%).
DemographicsRating | RankUnemployment
Norwegians
100.0
/100
|
#1
Exceptional
4.2%
Luxembourgers
100.0
/100
|
#2
Exceptional
4.3%
Czechs
100.0
/100
|
#3
Exceptional
4.3%
Danes
100.0
/100
|
#4
Exceptional
4.3%
Swedes
100.0
/100
|
#5
Exceptional
4.4%
Germans
100.0
/100
|
#6
Exceptional
4.5%
Immigrants | India
100.0
/100
|
#7
Exceptional
4.5%
Swiss
100.0
/100
|
#8
Exceptional
4.5%
Scandinavians
100.0
/100
|
#9
Exceptional
4.5%
Dutch
100.0
/100
|
#10
Exceptional
4.6%
English
100.0
/100
|
#11
Exceptional
4.6%
Pennsylvania Germans
100.0
/100
|
#12
Exceptional
4.6%
Belgians
100.0
/100
|
#13
Exceptional
4.6%
Immigrants | Cuba
100.0
/100
|
#14
Exceptional
4.6%
Europeans
99.9
/100
|
#15
Exceptional
4.6%

Demographics Similar to Immigrants from Czechoslovakia by Unemployment

In terms of unemployment, the demographic groups most similar to Immigrants from Czechoslovakia are Immigrants from England (5.0%, a difference of 0.030%), Romanian (5.0%, a difference of 0.030%), Mongolian (5.0%, a difference of 0.10%), Estonian (5.0%, a difference of 0.16%), and Immigrants from Serbia (5.0%, a difference of 0.19%).
DemographicsRating | RankUnemployment
Immigrants | North Macedonia
96.3
/100
|
#90
Exceptional
5.0%
Immigrants | Sudan
96.3
/100
|
#91
Exceptional
5.0%
Immigrants | South Africa
96.2
/100
|
#92
Exceptional
5.0%
Ukrainians
96.0
/100
|
#93
Exceptional
5.0%
Immigrants | Austria
95.9
/100
|
#94
Exceptional
5.0%
Immigrants | Serbia
95.6
/100
|
#95
Exceptional
5.0%
Immigrants | England
95.2
/100
|
#96
Exceptional
5.0%
Immigrants | Czechoslovakia
95.1
/100
|
#97
Exceptional
5.0%
Romanians
95.0
/100
|
#98
Exceptional
5.0%
Mongolians
94.8
/100
|
#99
Exceptional
5.0%
Estonians
94.6
/100
|
#100
Exceptional
5.0%
Americans
94.3
/100
|
#101
Exceptional
5.0%
Immigrants | Argentina
94.1
/100
|
#102
Exceptional
5.0%
Chickasaw
94.0
/100
|
#103
Exceptional
5.0%
Osage
94.0
/100
|
#104
Exceptional
5.0%