Sudanese vs Immigrants from Syria Unemployment Among Ages 60 to 64 years

COMPARE

Sudanese
Race
Ancestry
AfghanAfricanAlaska NativeAlaskan AthabascanAlbanianAleutAlsatianAmericanApacheArabArapahoArgentineanArmenianAssyrian/Chaldean/SyriacAustralianAustrianBahamianBangladeshiBarbadianBasqueBelgianBelizeanBermudanBhutaneseBlackfeetBolivianBrazilianBritishBritish West IndianBulgarianBurmeseCajunCambodianCanadianCape VerdeanCarpatho RusynCelticCentral AmericanCentral American IndianCherokeeCheyenneChickasawChileanChineseChippewaChoctawColombianColvilleComancheCosta RicanCreeCreekCroatianCrowCubanCypriotCzechCzechoslovakianDanishDelawareDominicanDutchDutch West IndianEastern EuropeanEcuadorianEgyptianEnglishEstonianEthiopianEuropeanFijianFilipinoFinnishFrenchFrench American IndianFrench CanadianGermanGerman RussianGhanaianGreekGuamanian/ChamorroGuatemalanGuyaneseHaitianHmongHonduranHopiHoumaHungarianIcelanderIndian (Asian)IndonesianInupiatIranianIraqiIrishIroquoisIsraeliItalianJamaicanJapaneseJordanianKenyanKiowaKoreanLaotianLatvianLebaneseLiberianLithuanianLumbeeLuxembourgerMacedonianMalaysianMalteseMarshalleseMenomineeMexicanMexican American IndianMongolianMoroccanNative HawaiianNavajoNepaleseNew ZealanderNicaraguanNigerianNorthern EuropeanNorwegianOkinawanOsageOttawaPaiutePakistaniPalestinianPanamanianParaguayanPennsylvania GermanPeruvianPimaPolishPortuguesePotawatomiPuebloPuerto RicanPuget Sound SalishRomanianRussianSalvadoranSamoanScandinavianScotch-IrishScottishSeminoleSenegaleseSerbianShoshoneSierra LeoneanSiouxSlavicSlovakSloveneSomaliSouth AfricanSouth AmericanSouth American IndianSoviet UnionSpaniardSpanishSpanish AmericanSpanish American IndianSri LankanSubsaharan AfricanSudaneseSwedishSwissSyrianTaiwaneseThaiTlingit-HaidaTohono O'OdhamTonganTrinidadian and TobagonianTsimshianTurkishU.S. Virgin IslanderUgandanUkrainianUruguayanUteVenezuelanVietnameseWelshWest IndianYakamaYaquiYugoslavianYumanYup'ikZimbabwean
Immigration
NonimmigrantsImmigrantsAfghanistanAfricaAlbaniaArgentinaArmeniaAsiaAustraliaAustriaBahamasBangladeshBarbadosBelarusBelgiumBelizeBoliviaBosnia and HerzegovinaBrazilBulgariaBurma/MyanmarCabo VerdeCambodiaCameroonCanadaCaribbeanCentral AmericaChileChinaColombiaCongoCosta RicaCroatiaCubaCzechoslovakiaDenmarkDominicaDominican RepublicEastern AfricaEastern AsiaEastern EuropeEcuadorEgyptEl SalvadorEnglandEritreaEthiopiaEuropeFijiFranceGermanyGhanaGreeceGrenadaGuatemalaGuyanaHaitiHondurasHong KongHungaryIndiaIndonesiaIranIraqIrelandIsraelItalyJamaicaJapanJordanKazakhstanKenyaKoreaKuwaitLaosLatin AmericaLatviaLebanonLiberiaLithuaniaMalaysiaMexicoMicronesiaMiddle AfricaMoldovaMoroccoNepalNetherlandsNicaraguaNigeriaNorth AmericaNorth MacedoniaNorthern AfricaNorthern EuropeNorwayOceaniaPakistanPanamaPeruPhilippinesPolandPortugalRomaniaRussiaSaudi ArabiaScotlandSenegalSerbiaSierra LeoneSingaporeSomaliaSouth AfricaSouth AmericaSouth Central AsiaSouth Eastern AsiaSouthern EuropeSpainSri LankaSt. Vincent and the GrenadinesSudanSwedenSwitzerlandTaiwanThailandTrinidad and TobagoTurkeyUgandaUkraineUruguayUzbekistanVenezuelaVietnamWest IndiesWestern AfricaWestern AsiaWestern EuropeYemenZaireZimbabweAzores
Immigrants from Syria
Race
Ancestry
AfghanAfricanAlaska NativeAlaskan AthabascanAlbanianAleutAlsatianAmericanApacheArabArapahoArgentineanArmenianAssyrian/Chaldean/SyriacAustralianAustrianBahamianBangladeshiBarbadianBasqueBelgianBelizeanBermudanBhutaneseBlackfeetBolivianBrazilianBritishBritish West IndianBulgarianBurmeseCajunCambodianCanadianCape VerdeanCarpatho RusynCelticCentral AmericanCentral American IndianCherokeeCheyenneChickasawChileanChineseChippewaChoctawColombianColvilleComancheCosta RicanCreeCreekCroatianCrowCubanCypriotCzechCzechoslovakianDanishDelawareDominicanDutchDutch West IndianEastern EuropeanEcuadorianEgyptianEnglishEstonianEthiopianEuropeanFijianFilipinoFinnishFrenchFrench American IndianFrench CanadianGermanGerman RussianGhanaianGreekGuamanian/ChamorroGuatemalanGuyaneseHaitianHmongHonduranHopiHoumaHungarianIcelanderIndian (Asian)IndonesianInupiatIranianIraqiIrishIroquoisIsraeliItalianJamaicanJapaneseJordanianKenyanKiowaKoreanLaotianLatvianLebaneseLiberianLithuanianLumbeeLuxembourgerMacedonianMalaysianMalteseMarshalleseMenomineeMexicanMexican American IndianMongolianMoroccanNative HawaiianNavajoNepaleseNew ZealanderNicaraguanNigerianNorthern EuropeanNorwegianOkinawanOsageOttawaPaiutePakistaniPalestinianPanamanianParaguayanPennsylvania GermanPeruvianPimaPolishPortuguesePotawatomiPuebloPuerto RicanPuget Sound SalishRomanianRussianSalvadoranSamoanScandinavianScotch-IrishScottishSeminoleSenegaleseSerbianShoshoneSierra LeoneanSiouxSlavicSlovakSloveneSomaliSouth AfricanSouth AmericanSouth American IndianSoviet UnionSpaniardSpanishSpanish AmericanSpanish American IndianSri LankanSubsaharan AfricanSwedishSwissSyrianTaiwaneseThaiTlingit-HaidaTohono O'OdhamTonganTrinidadian and TobagonianTsimshianTurkishU.S. Virgin IslanderUgandanUkrainianUruguayanUteVenezuelanVietnameseWelshWest IndianYakamaYaquiYugoslavianYumanYup'ikZimbabwean
Immigration
NonimmigrantsImmigrantsAfghanistanAfricaAlbaniaArgentinaArmeniaAsiaAustraliaAustriaBahamasBangladeshBarbadosBelarusBelgiumBelizeBoliviaBosnia and HerzegovinaBrazilBulgariaBurma/MyanmarCabo VerdeCambodiaCameroonCanadaCaribbeanCentral AmericaChileChinaColombiaCongoCosta RicaCroatiaCubaCzechoslovakiaDenmarkDominicaDominican RepublicEastern AfricaEastern AsiaEastern EuropeEcuadorEgyptEl SalvadorEnglandEritreaEthiopiaEuropeFijiFranceGermanyGhanaGreeceGrenadaGuatemalaGuyanaHaitiHondurasHong KongHungaryIndiaIndonesiaIranIraqIrelandIsraelItalyJamaicaJapanJordanKazakhstanKenyaKoreaKuwaitLaosLatin AmericaLatviaLebanonLiberiaLithuaniaMalaysiaMexicoMicronesiaMiddle AfricaMoldovaMoroccoNepalNetherlandsNicaraguaNigeriaNorth AmericaNorth MacedoniaNorthern AfricaNorthern EuropeNorwayOceaniaPakistanPanamaPeruPhilippinesPolandPortugalRomaniaRussiaSaudi ArabiaScotlandSenegalSerbiaSierra LeoneSingaporeSomaliaSouth AfricaSouth AmericaSouth Central AsiaSouth Eastern AsiaSouthern EuropeSpainSri LankaSt. Vincent and the GrenadinesSudanSwedenSwitzerlandSyriaTaiwanThailandTrinidad and TobagoTurkeyUgandaUkraineUruguayUzbekistanVenezuelaVietnamWest IndiesWestern AfricaWestern AsiaWestern EuropeYemenZaireZimbabweAzores
Unemployment Among Ages 60 to 64 years
Income
Poverty
Unemployment
Labor Participation
Family Structure
Vehicle Availability
Education Level
Disability

Unemployment Among Ages 60 to 64 years Comparison

Sudanese

Immigrants from Syria

Exceptional
Exceptional
4.3%
UNEMPLOYMENT AMONG AGES 60 TO 64 YEARS
100.0/ 100
METRIC RATING
15th/ 347
METRIC RANK
4.8%
UNEMPLOYMENT AMONG AGES 60 TO 64 YEARS
90.1/ 100
METRIC RATING
130th/ 347
METRIC RANK

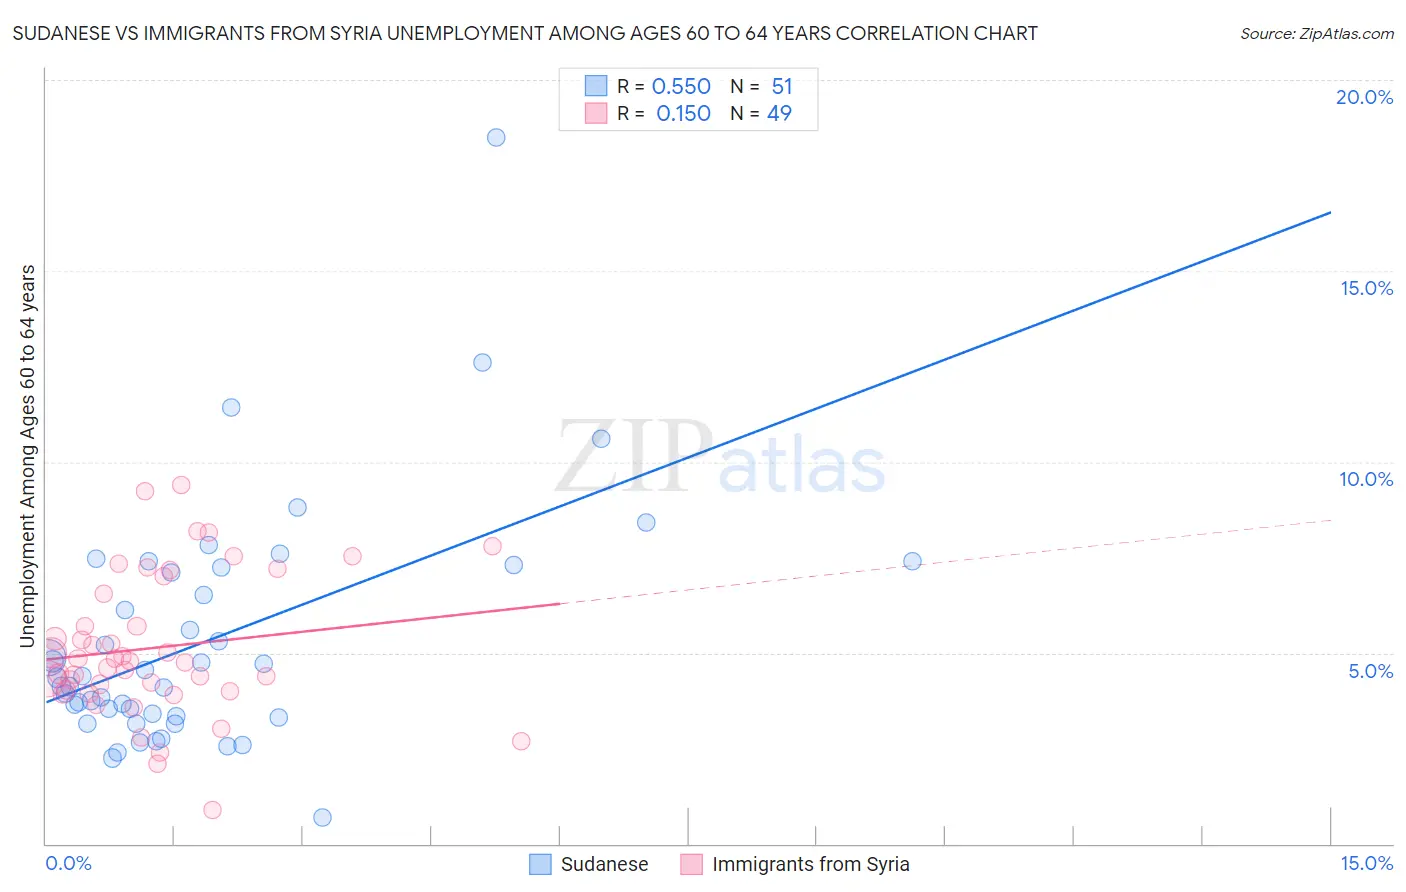
Sudanese vs Immigrants from Syria Unemployment Among Ages 60 to 64 years Correlation Chart

The statistical analysis conducted on geographies consisting of 105,864,294 people shows a substantial positive correlation between the proportion of Sudanese and unemployment rate among population between the ages 60 and 64 in the United States with a correlation coefficient (R) of 0.550 and weighted average of 4.3%. Similarly, the statistical analysis conducted on geographies consisting of 167,840,010 people shows a poor positive correlation between the proportion of Immigrants from Syria and unemployment rate among population between the ages 60 and 64 in the United States with a correlation coefficient (R) of 0.150 and weighted average of 4.8%, a difference of 9.5%.
Sudanese vs Immigrants from Syria Unemployment Among Ages 60 to 64 years

Unemployment Among Ages 60 to 64 years Correlation Summary

MeasurementSudaneseImmigrants from Syria
Minimum0.70%0.90%
Maximum18.5%9.4%
Range17.8%8.5%
Mean5.3%5.1%
Median4.3%4.8%
Interquartile 25% (IQ1)3.3%4.0%
Interquartile 75% (IQ3)7.2%6.8%
Interquartile Range (IQR)3.9%2.8%
Standard Deviation (Sample)3.1%1.9%
Standard Deviation (Population)3.1%1.8%

Similar Demographics by Unemployment Among Ages 60 to 64 years

Demographics Similar to Sudanese by Unemployment Among Ages 60 to 64 years

In terms of unemployment among ages 60 to 64 years, the demographic groups most similar to Sudanese are Danish (4.4%, a difference of 0.26%), Immigrants from Afghanistan (4.4%, a difference of 0.42%), Norwegian (4.3%, a difference of 0.50%), Chickasaw (4.3%, a difference of 0.55%), and Immigrants from Cuba (4.3%, a difference of 0.60%).
DemographicsRating | RankUnemployment Among Ages 60 to 64 years
Immigrants | Micronesia
100.0
/100
|
#8
Exceptional
4.2%
Indonesians
100.0
/100
|
#9
Exceptional
4.2%
Immigrants | Bosnia and Herzegovina
100.0
/100
|
#10
Exceptional
4.2%
Luxembourgers
100.0
/100
|
#11
Exceptional
4.3%
Immigrants | Cuba
100.0
/100
|
#12
Exceptional
4.3%
Chickasaw
100.0
/100
|
#13
Exceptional
4.3%
Norwegians
100.0
/100
|
#14
Exceptional
4.3%
Sudanese
100.0
/100
|
#15
Exceptional
4.3%
Danes
100.0
/100
|
#16
Exceptional
4.4%
Immigrants | Afghanistan
100.0
/100
|
#17
Exceptional
4.4%
Slovenes
100.0
/100
|
#18
Exceptional
4.4%
Tsimshian
100.0
/100
|
#19
Exceptional
4.4%
Afghans
100.0
/100
|
#20
Exceptional
4.4%
Immigrants | Cabo Verde
100.0
/100
|
#21
Exceptional
4.4%
Cape Verdeans
100.0
/100
|
#22
Exceptional
4.4%

Demographics Similar to Immigrants from Syria by Unemployment Among Ages 60 to 64 years

In terms of unemployment among ages 60 to 64 years, the demographic groups most similar to Immigrants from Syria are Immigrants from Serbia (4.8%, a difference of 0.010%), Choctaw (4.8%, a difference of 0.020%), Immigrants from Lebanon (4.8%, a difference of 0.050%), Lithuanian (4.8%, a difference of 0.060%), and Yaqui (4.8%, a difference of 0.070%).
DemographicsRating | RankUnemployment Among Ages 60 to 64 years
Finns
94.7
/100
|
#123
Exceptional
4.7%
Immigrants | Senegal
94.5
/100
|
#124
Exceptional
4.7%
Immigrants | Thailand
93.7
/100
|
#125
Exceptional
4.7%
Immigrants | South Central Asia
93.0
/100
|
#126
Exceptional
4.7%
Austrians
91.9
/100
|
#127
Exceptional
4.8%
Choctaw
90.3
/100
|
#128
Exceptional
4.8%
Immigrants | Serbia
90.2
/100
|
#129
Exceptional
4.8%
Immigrants | Syria
90.1
/100
|
#130
Exceptional
4.8%
Immigrants | Lebanon
89.6
/100
|
#131
Excellent
4.8%
Lithuanians
89.6
/100
|
#132
Excellent
4.8%
Yaqui
89.5
/100
|
#133
Excellent
4.8%
Basques
88.8
/100
|
#134
Excellent
4.8%
Pennsylvania Germans
87.8
/100
|
#135
Excellent
4.8%
French Canadians
87.6
/100
|
#136
Excellent
4.8%
Cambodians
86.9
/100
|
#137
Excellent
4.8%