Sudanese vs Immigrants from Kazakhstan Unemployment
COMPARE
Sudanese
Immigrants from Kazakhstan
Unemployment
Unemployment Comparison
Sudanese
Immigrants from Kazakhstan
4.8%
UNEMPLOYMENT
99.8/ 100
METRIC RATING
33rd/ 347
METRIC RANK
5.2%
UNEMPLOYMENT
70.4/ 100
METRIC RATING
156th/ 347
METRIC RANK
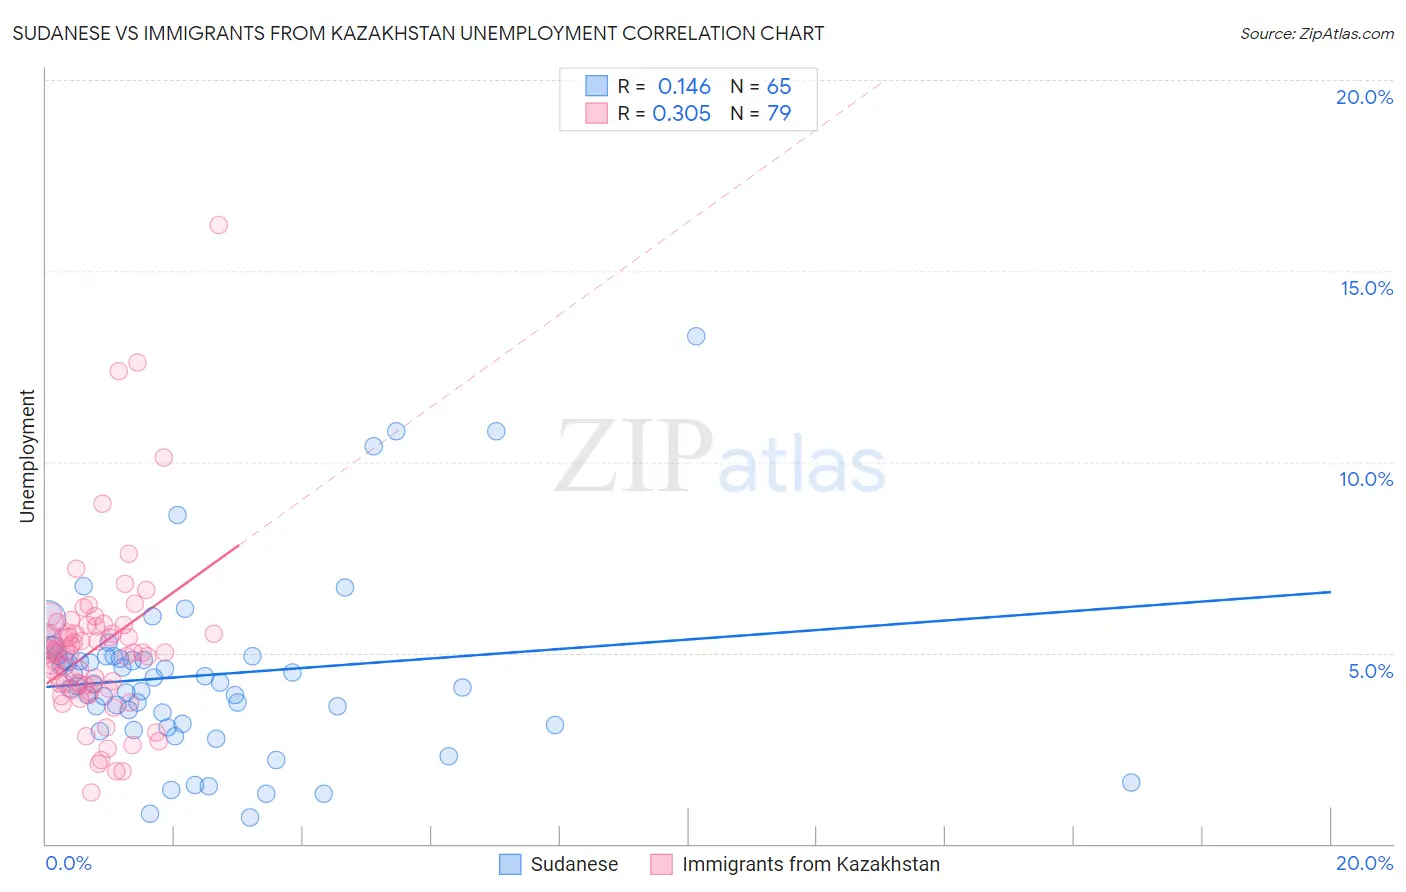
Sudanese vs Immigrants from Kazakhstan Unemployment Correlation Chart
The statistical analysis conducted on geographies consisting of 110,101,890 people shows a poor positive correlation between the proportion of Sudanese and unemployment in the United States with a correlation coefficient (R) of 0.146 and weighted average of 4.8%. Similarly, the statistical analysis conducted on geographies consisting of 124,418,650 people shows a mild positive correlation between the proportion of Immigrants from Kazakhstan and unemployment in the United States with a correlation coefficient (R) of 0.305 and weighted average of 5.2%, a difference of 8.9%.
Unemployment Correlation Summary
| Measurement | Sudanese | Immigrants from Kazakhstan |
| Minimum | 0.70% | 1.3% |
| Maximum | 13.3% | 16.2% |
| Range | 12.6% | 14.9% |
| Mean | 4.4% | 5.1% |
| Median | 4.2% | 5.0% |
| Interquartile 25% (IQ1) | 3.1% | 4.0% |
| Interquartile 75% (IQ3) | 4.9% | 5.7% |
| Interquartile Range (IQR) | 1.8% | 1.6% |
| Standard Deviation (Sample) | 2.3% | 2.3% |
| Standard Deviation (Population) | 2.3% | 2.3% |
Similar Demographics by Unemployment
Demographics Similar to Sudanese by Unemployment
In terms of unemployment, the demographic groups most similar to Sudanese are Zimbabwean (4.8%, a difference of 0.010%), Immigrants from Bolivia (4.8%, a difference of 0.040%), Croatian (4.8%, a difference of 0.11%), Scotch-Irish (4.8%, a difference of 0.11%), and Irish (4.8%, a difference of 0.13%).
| Demographics | Rating | Rank | Unemployment |
| Bulgarians | 99.9 /100 | #26 | Exceptional 4.7% |
| Finns | 99.9 /100 | #27 | Exceptional 4.7% |
| Cubans | 99.8 /100 | #28 | Exceptional 4.7% |
| Poles | 99.8 /100 | #29 | Exceptional 4.7% |
| Irish | 99.8 /100 | #30 | Exceptional 4.8% |
| Croatians | 99.8 /100 | #31 | Exceptional 4.8% |
| Zimbabweans | 99.8 /100 | #32 | Exceptional 4.8% |
| Sudanese | 99.8 /100 | #33 | Exceptional 4.8% |
| Immigrants | Bolivia | 99.8 /100 | #34 | Exceptional 4.8% |
| Scotch-Irish | 99.8 /100 | #35 | Exceptional 4.8% |
| Tongans | 99.7 /100 | #36 | Exceptional 4.8% |
| Czechoslovakians | 99.7 /100 | #37 | Exceptional 4.8% |
| Bolivians | 99.7 /100 | #38 | Exceptional 4.8% |
| Lithuanians | 99.7 /100 | #39 | Exceptional 4.8% |
| Northern Europeans | 99.7 /100 | #40 | Exceptional 4.8% |
Demographics Similar to Immigrants from Kazakhstan by Unemployment
In terms of unemployment, the demographic groups most similar to Immigrants from Kazakhstan are Sri Lankan (5.2%, a difference of 0.060%), Immigrants from Northern Africa (5.2%, a difference of 0.070%), Immigrants from Egypt (5.2%, a difference of 0.27%), Immigrants from Russia (5.2%, a difference of 0.27%), and Laotian (5.2%, a difference of 0.29%).
| Demographics | Rating | Rank | Unemployment |
| Syrians | 77.7 /100 | #149 | Good 5.2% |
| Potawatomi | 76.2 /100 | #150 | Good 5.2% |
| Immigrants | Eastern Europe | 75.3 /100 | #151 | Good 5.2% |
| Immigrants | Hong Kong | 75.2 /100 | #152 | Good 5.2% |
| Egyptians | 75.2 /100 | #153 | Good 5.2% |
| Immigrants | China | 74.7 /100 | #154 | Good 5.2% |
| Immigrants | Northern Africa | 71.3 /100 | #155 | Good 5.2% |
| Immigrants | Kazakhstan | 70.4 /100 | #156 | Good 5.2% |
| Sri Lankans | 69.5 /100 | #157 | Good 5.2% |
| Immigrants | Egypt | 66.7 /100 | #158 | Good 5.2% |
| Immigrants | Russia | 66.6 /100 | #159 | Good 5.2% |
| Laotians | 66.3 /100 | #160 | Good 5.2% |
| Immigrants | Oceania | 65.2 /100 | #161 | Good 5.2% |
| Spanish | 65.1 /100 | #162 | Good 5.2% |
| Immigrants | Zaire | 64.7 /100 | #163 | Good 5.2% |