Sudanese vs Immigrants from Chile Unemployment Among Ages 55 to 59 years

COMPARE

Sudanese
Race
Ancestry
AfghanAfricanAlaska NativeAlaskan AthabascanAlbanianAleutAlsatianAmericanApacheArabArapahoArgentineanArmenianAssyrian/Chaldean/SyriacAustralianAustrianBahamianBangladeshiBarbadianBasqueBelgianBelizeanBermudanBhutaneseBlackfeetBolivianBrazilianBritishBritish West IndianBulgarianBurmeseCajunCambodianCanadianCape VerdeanCarpatho RusynCelticCentral AmericanCentral American IndianCherokeeCheyenneChickasawChileanChineseChippewaChoctawColombianColvilleComancheCosta RicanCreeCreekCroatianCrowCubanCypriotCzechCzechoslovakianDanishDelawareDominicanDutchDutch West IndianEastern EuropeanEcuadorianEgyptianEnglishEstonianEthiopianEuropeanFijianFilipinoFinnishFrenchFrench American IndianFrench CanadianGermanGerman RussianGhanaianGreekGuamanian/ChamorroGuatemalanGuyaneseHaitianHmongHonduranHopiHoumaHungarianIcelanderIndian (Asian)IndonesianInupiatIranianIraqiIrishIroquoisIsraeliItalianJamaicanJapaneseJordanianKenyanKiowaKoreanLaotianLatvianLebaneseLiberianLithuanianLumbeeLuxembourgerMacedonianMalaysianMalteseMarshalleseMenomineeMexicanMexican American IndianMongolianMoroccanNative HawaiianNavajoNepaleseNew ZealanderNicaraguanNigerianNorthern EuropeanNorwegianOkinawanOsageOttawaPaiutePakistaniPalestinianPanamanianParaguayanPennsylvania GermanPeruvianPimaPolishPortuguesePotawatomiPuebloPuerto RicanPuget Sound SalishRomanianRussianSalvadoranSamoanScandinavianScotch-IrishScottishSeminoleSenegaleseSerbianShoshoneSierra LeoneanSiouxSlavicSlovakSloveneSomaliSouth AfricanSouth AmericanSouth American IndianSoviet UnionSpaniardSpanishSpanish AmericanSpanish American IndianSri LankanSubsaharan AfricanSudaneseSwedishSwissSyrianTaiwaneseThaiTlingit-HaidaTohono O'OdhamTonganTrinidadian and TobagonianTsimshianTurkishU.S. Virgin IslanderUgandanUkrainianUruguayanUteVenezuelanVietnameseWelshWest IndianYakamaYaquiYugoslavianYumanYup'ikZimbabwean
Immigration
NonimmigrantsImmigrantsAfghanistanAfricaAlbaniaArgentinaArmeniaAsiaAustraliaAustriaBahamasBangladeshBarbadosBelarusBelgiumBelizeBoliviaBosnia and HerzegovinaBrazilBulgariaBurma/MyanmarCabo VerdeCambodiaCameroonCanadaCaribbeanCentral AmericaChinaColombiaCongoCosta RicaCroatiaCubaCzechoslovakiaDenmarkDominicaDominican RepublicEastern AfricaEastern AsiaEastern EuropeEcuadorEgyptEl SalvadorEnglandEritreaEthiopiaEuropeFijiFranceGermanyGhanaGreeceGrenadaGuatemalaGuyanaHaitiHondurasHong KongHungaryIndiaIndonesiaIranIraqIrelandIsraelItalyJamaicaJapanJordanKazakhstanKenyaKoreaKuwaitLaosLatin AmericaLatviaLebanonLiberiaLithuaniaMalaysiaMexicoMicronesiaMiddle AfricaMoldovaMoroccoNepalNetherlandsNicaraguaNigeriaNorth AmericaNorth MacedoniaNorthern AfricaNorthern EuropeNorwayOceaniaPakistanPanamaPeruPhilippinesPolandPortugalRomaniaRussiaSaudi ArabiaScotlandSenegalSerbiaSierra LeoneSingaporeSomaliaSouth AfricaSouth AmericaSouth Central AsiaSouth Eastern AsiaSouthern EuropeSpainSri LankaSt. Vincent and the GrenadinesSudanSwedenSwitzerlandSyriaTaiwanThailandTrinidad and TobagoTurkeyUgandaUkraineUruguayUzbekistanVenezuelaVietnamWest IndiesWestern AfricaWestern AsiaWestern EuropeYemenZaireZimbabweAzores
Immigrants from Chile
Race
Ancestry
AfghanAfricanAlaska NativeAlaskan AthabascanAlbanianAleutAlsatianAmericanApacheArabArapahoArgentineanArmenianAssyrian/Chaldean/SyriacAustralianAustrianBahamianBangladeshiBarbadianBasqueBelgianBelizeanBermudanBhutaneseBlackfeetBolivianBrazilianBritishBritish West IndianBulgarianBurmeseCajunCambodianCanadianCape VerdeanCarpatho RusynCelticCentral AmericanCentral American IndianCherokeeCheyenneChickasawChileanChineseChippewaChoctawColombianColvilleComancheCosta RicanCreeCreekCroatianCrowCubanCypriotCzechCzechoslovakianDanishDelawareDominicanDutchDutch West IndianEastern EuropeanEcuadorianEgyptianEnglishEstonianEthiopianEuropeanFijianFilipinoFinnishFrenchFrench American IndianFrench CanadianGermanGerman RussianGhanaianGreekGuamanian/ChamorroGuatemalanGuyaneseHaitianHmongHonduranHopiHoumaHungarianIcelanderIndian (Asian)IndonesianInupiatIranianIraqiIrishIroquoisIsraeliItalianJamaicanJapaneseJordanianKenyanKiowaKoreanLaotianLatvianLebaneseLiberianLithuanianLumbeeLuxembourgerMacedonianMalaysianMalteseMarshalleseMenomineeMexicanMexican American IndianMongolianMoroccanNative HawaiianNavajoNepaleseNew ZealanderNicaraguanNigerianNorthern EuropeanNorwegianOkinawanOsageOttawaPaiutePakistaniPalestinianPanamanianParaguayanPennsylvania GermanPeruvianPimaPolishPortuguesePotawatomiPuebloPuerto RicanPuget Sound SalishRomanianRussianSalvadoranSamoanScandinavianScotch-IrishScottishSeminoleSenegaleseSerbianShoshoneSierra LeoneanSiouxSlavicSlovakSloveneSomaliSouth AfricanSouth AmericanSouth American IndianSoviet UnionSpaniardSpanishSpanish AmericanSpanish American IndianSri LankanSubsaharan AfricanSwedishSwissSyrianTaiwaneseThaiTlingit-HaidaTohono O'OdhamTonganTrinidadian and TobagonianTsimshianTurkishU.S. Virgin IslanderUgandanUkrainianUruguayanUteVenezuelanVietnameseWelshWest IndianYakamaYaquiYugoslavianYumanYup'ikZimbabwean
Immigration
NonimmigrantsImmigrantsAfghanistanAfricaAlbaniaArgentinaArmeniaAsiaAustraliaAustriaBahamasBangladeshBarbadosBelarusBelgiumBelizeBoliviaBosnia and HerzegovinaBrazilBulgariaBurma/MyanmarCabo VerdeCambodiaCameroonCanadaCaribbeanCentral AmericaChileChinaColombiaCongoCosta RicaCroatiaCubaCzechoslovakiaDenmarkDominicaDominican RepublicEastern AfricaEastern AsiaEastern EuropeEcuadorEgyptEl SalvadorEnglandEritreaEthiopiaEuropeFijiFranceGermanyGhanaGreeceGrenadaGuatemalaGuyanaHaitiHondurasHong KongHungaryIndiaIndonesiaIranIraqIrelandIsraelItalyJamaicaJapanJordanKazakhstanKenyaKoreaKuwaitLaosLatin AmericaLatviaLebanonLiberiaLithuaniaMalaysiaMexicoMicronesiaMiddle AfricaMoldovaMoroccoNepalNetherlandsNicaraguaNigeriaNorth AmericaNorth MacedoniaNorthern AfricaNorthern EuropeNorwayOceaniaPakistanPanamaPeruPhilippinesPolandPortugalRomaniaRussiaSaudi ArabiaScotlandSenegalSerbiaSierra LeoneSingaporeSomaliaSouth AfricaSouth AmericaSouth Central AsiaSouth Eastern AsiaSouthern EuropeSpainSri LankaSt. Vincent and the GrenadinesSudanSwedenSwitzerlandSyriaTaiwanThailandTrinidad and TobagoTurkeyUgandaUkraineUruguayUzbekistanVenezuelaVietnamWest IndiesWestern AfricaWestern AsiaWestern EuropeYemenZaireZimbabweAzores
Unemployment Among Ages 55 to 59 years
Income
Poverty
Unemployment
Labor Participation
Family Structure
Vehicle Availability
Education Level
Disability

Unemployment Among Ages 55 to 59 years Comparison

Sudanese

Immigrants from Chile

Exceptional
Exceptional
4.6%
UNEMPLOYMENT AMONG AGES 55 TO 59 YEARS
99.1/ 100
METRIC RATING
65th/ 347
METRIC RANK
4.7%
UNEMPLOYMENT AMONG AGES 55 TO 59 YEARS
90.7/ 100
METRIC RATING
118th/ 347
METRIC RANK

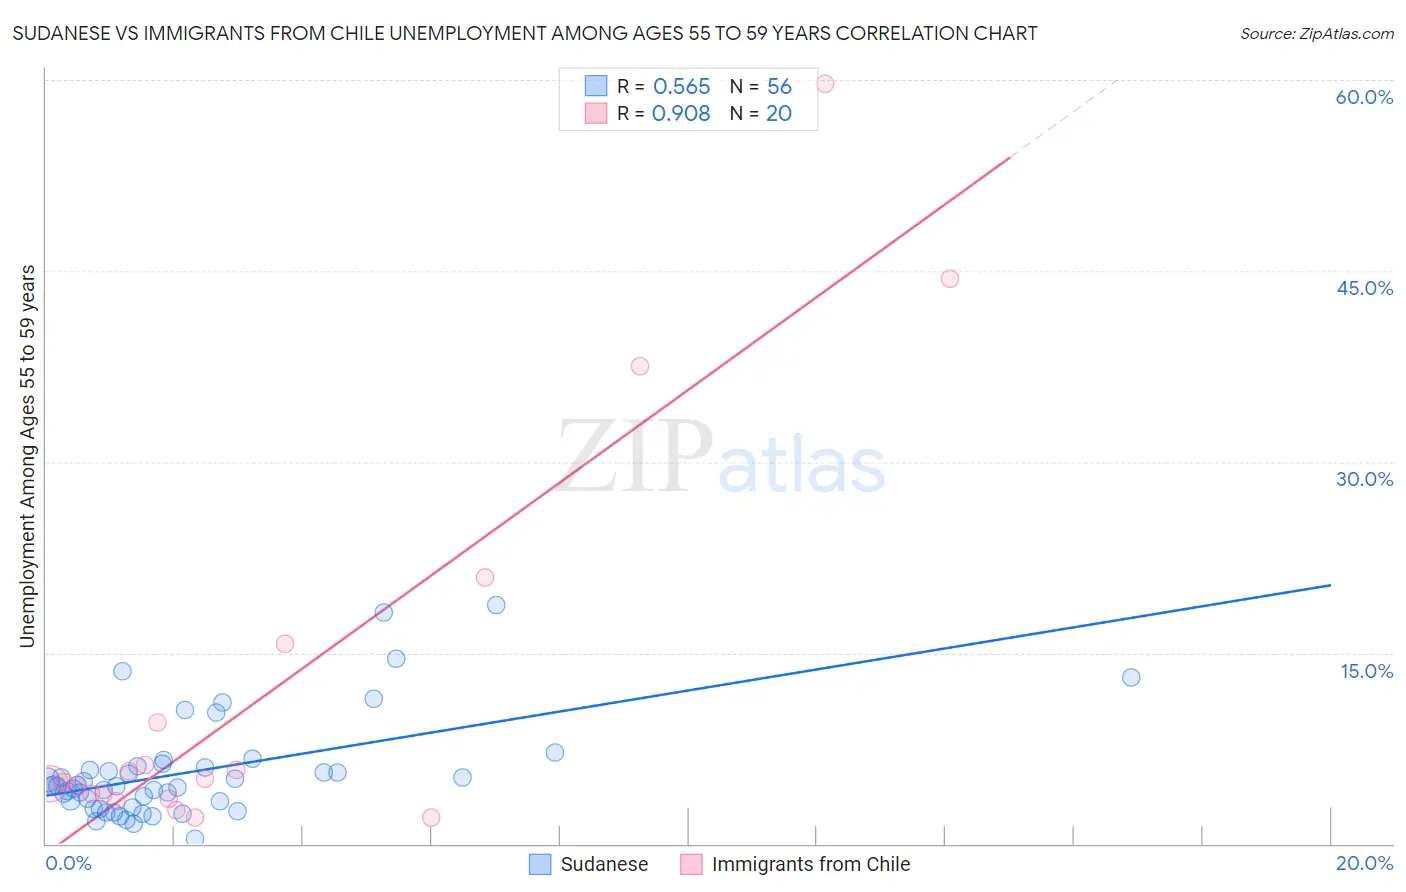
Sudanese vs Immigrants from Chile Unemployment Among Ages 55 to 59 years Correlation Chart

The statistical analysis conducted on geographies consisting of 107,452,803 people shows a substantial positive correlation between the proportion of Sudanese and unemployment rate among population between the ages 55 and 59 in the United States with a correlation coefficient (R) of 0.565 and weighted average of 4.6%. Similarly, the statistical analysis conducted on geographies consisting of 211,435,143 people shows a near-perfect positive correlation between the proportion of Immigrants from Chile and unemployment rate among population between the ages 55 and 59 in the United States with a correlation coefficient (R) of 0.908 and weighted average of 4.7%, a difference of 2.6%.
Sudanese vs Immigrants from Chile Unemployment Among Ages 55 to 59 years

Unemployment Among Ages 55 to 59 years Correlation Summary

MeasurementSudaneseImmigrants from Chile
Minimum0.40%2.1%
Maximum18.8%59.7%
Range18.4%57.6%
Mean5.6%12.3%
Median4.5%5.0%
Interquartile 25% (IQ1)3.1%3.7%
Interquartile 75% (IQ3)6.0%12.6%
Interquartile Range (IQR)3.0%8.9%
Standard Deviation (Sample)4.0%16.1%
Standard Deviation (Population)3.9%15.7%

Similar Demographics by Unemployment Among Ages 55 to 59 years

Demographics Similar to Sudanese by Unemployment Among Ages 55 to 59 years

In terms of unemployment among ages 55 to 59 years, the demographic groups most similar to Sudanese are Argentinean (4.6%, a difference of 0.010%), Mongolian (4.6%, a difference of 0.14%), Ugandan (4.6%, a difference of 0.17%), Immigrants from Micronesia (4.6%, a difference of 0.18%), and Immigrants from South Central Asia (4.6%, a difference of 0.19%).
DemographicsRating | RankUnemployment Among Ages 55 to 59 years
Okinawans
99.6
/100
|
#58
Exceptional
4.5%
Immigrants | Uganda
99.5
/100
|
#59
Exceptional
4.6%
Dutch
99.5
/100
|
#60
Exceptional
4.6%
Immigrants | Argentina
99.5
/100
|
#61
Exceptional
4.6%
Slovenes
99.3
/100
|
#62
Exceptional
4.6%
Immigrants | South Central Asia
99.3
/100
|
#63
Exceptional
4.6%
Argentineans
99.1
/100
|
#64
Exceptional
4.6%
Sudanese
99.1
/100
|
#65
Exceptional
4.6%
Mongolians
99.0
/100
|
#66
Exceptional
4.6%
Ugandans
99.0
/100
|
#67
Exceptional
4.6%
Immigrants | Micronesia
99.0
/100
|
#68
Exceptional
4.6%
Czechoslovakians
99.0
/100
|
#69
Exceptional
4.6%
Filipinos
98.8
/100
|
#70
Exceptional
4.6%
Immigrants | Jordan
98.7
/100
|
#71
Exceptional
4.6%
Immigrants | Taiwan
98.7
/100
|
#72
Exceptional
4.6%

Demographics Similar to Immigrants from Chile by Unemployment Among Ages 55 to 59 years

In terms of unemployment among ages 55 to 59 years, the demographic groups most similar to Immigrants from Chile are White/Caucasian (4.7%, a difference of 0.0%), Turkish (4.7%, a difference of 0.020%), Asian (4.7%, a difference of 0.020%), South American Indian (4.7%, a difference of 0.030%), and Bangladeshi (4.7%, a difference of 0.080%).
DemographicsRating | RankUnemployment Among Ages 55 to 59 years
Austrians
92.4
/100
|
#111
Exceptional
4.7%
Afghans
92.1
/100
|
#112
Exceptional
4.7%
Immigrants | Spain
91.4
/100
|
#113
Exceptional
4.7%
Bangladeshis
91.3
/100
|
#114
Exceptional
4.7%
South American Indians
90.9
/100
|
#115
Exceptional
4.7%
Turks
90.9
/100
|
#116
Exceptional
4.7%
Asians
90.8
/100
|
#117
Exceptional
4.7%
Immigrants | Chile
90.7
/100
|
#118
Exceptional
4.7%
Whites/Caucasians
90.7
/100
|
#119
Exceptional
4.7%
Immigrants | South Africa
89.9
/100
|
#120
Excellent
4.7%
Pakistanis
89.7
/100
|
#121
Excellent
4.7%
Immigrants | Afghanistan
89.5
/100
|
#122
Excellent
4.7%
Immigrants | Japan
89.4
/100
|
#123
Excellent
4.7%
Lithuanians
88.8
/100
|
#124
Excellent
4.7%
Immigrants | Malaysia
87.9
/100
|
#125
Excellent
4.7%