Subsaharan African vs Belizean Unemployment Among Seniors over 75 years
COMPARE
Subsaharan African
Belizean
Unemployment Among Seniors over 75 years
Unemployment Among Seniors over 75 years Comparison
Sub-Saharan Africans
Belizeans
9.2%
UNEMPLOYMENT AMONG SENIORS OVER 75 YEARS
2.3/ 100
METRIC RATING
247th/ 347
METRIC RANK
8.4%
UNEMPLOYMENT AMONG SENIORS OVER 75 YEARS
96.3/ 100
METRIC RATING
126th/ 347
METRIC RANK
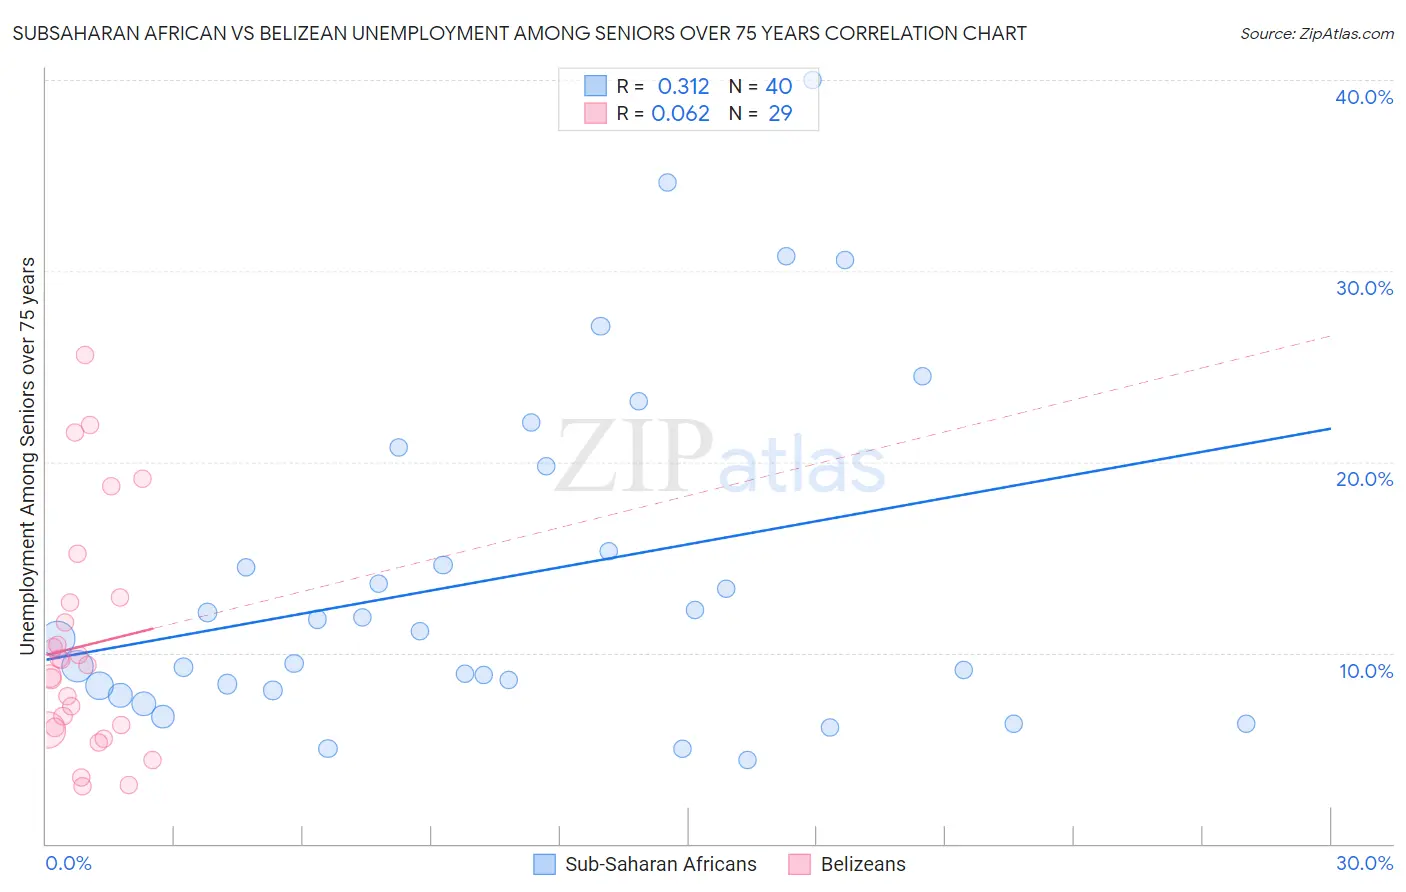
Subsaharan African vs Belizean Unemployment Among Seniors over 75 years Correlation Chart
The statistical analysis conducted on geographies consisting of 227,990,978 people shows a mild positive correlation between the proportion of Sub-Saharan Africans and unemployment rate among seniors over the age of 75 in the United States with a correlation coefficient (R) of 0.312 and weighted average of 9.2%. Similarly, the statistical analysis conducted on geographies consisting of 103,352,649 people shows a slight positive correlation between the proportion of Belizeans and unemployment rate among seniors over the age of 75 in the United States with a correlation coefficient (R) of 0.062 and weighted average of 8.4%, a difference of 9.8%.
Unemployment Among Seniors over 75 years Correlation Summary
| Measurement | Subsaharan African | Belizean |
| Minimum | 4.4% | 3.0% |
| Maximum | 40.0% | 25.6% |
| Range | 35.6% | 22.6% |
| Mean | 13.9% | 10.4% |
| Median | 10.9% | 9.4% |
| Interquartile 25% (IQ1) | 8.2% | 6.0% |
| Interquartile 75% (IQ3) | 17.5% | 12.8% |
| Interquartile Range (IQR) | 9.4% | 6.7% |
| Standard Deviation (Sample) | 8.8% | 6.0% |
| Standard Deviation (Population) | 8.7% | 5.9% |
Similar Demographics by Unemployment Among Seniors over 75 years
Demographics Similar to Sub-Saharan Africans by Unemployment Among Seniors over 75 years
In terms of unemployment among seniors over 75 years, the demographic groups most similar to Sub-Saharan Africans are Immigrants from North America (9.2%, a difference of 0.020%), Blackfeet (9.2%, a difference of 0.040%), Immigrants from Saudi Arabia (9.2%, a difference of 0.090%), Central American Indian (9.2%, a difference of 0.10%), and Immigrants from Canada (9.2%, a difference of 0.14%).
| Demographics | Rating | Rank | Unemployment Among Seniors over 75 years |
| Spanish | 3.3 /100 | #240 | Tragic 9.1% |
| Immigrants | Southern Europe | 2.8 /100 | #241 | Tragic 9.2% |
| Sierra Leoneans | 2.8 /100 | #242 | Tragic 9.2% |
| Slavs | 2.8 /100 | #243 | Tragic 9.2% |
| Immigrants | Germany | 2.7 /100 | #244 | Tragic 9.2% |
| Immigrants | Canada | 2.6 /100 | #245 | Tragic 9.2% |
| Immigrants | North America | 2.4 /100 | #246 | Tragic 9.2% |
| Sub-Saharan Africans | 2.3 /100 | #247 | Tragic 9.2% |
| Blackfeet | 2.3 /100 | #248 | Tragic 9.2% |
| Immigrants | Saudi Arabia | 2.2 /100 | #249 | Tragic 9.2% |
| Central American Indians | 2.2 /100 | #250 | Tragic 9.2% |
| Immigrants | Poland | 2.0 /100 | #251 | Tragic 9.2% |
| Immigrants | Sudan | 2.0 /100 | #252 | Tragic 9.2% |
| Pima | 1.8 /100 | #253 | Tragic 9.2% |
| Immigrants | Ghana | 1.7 /100 | #254 | Tragic 9.2% |
Demographics Similar to Belizeans by Unemployment Among Seniors over 75 years
In terms of unemployment among seniors over 75 years, the demographic groups most similar to Belizeans are Honduran (8.4%, a difference of 0.010%), Native Hawaiian (8.4%, a difference of 0.050%), Ghanaian (8.4%, a difference of 0.090%), Immigrants from Moldova (8.3%, a difference of 0.20%), and Thai (8.3%, a difference of 0.22%).
| Demographics | Rating | Rank | Unemployment Among Seniors over 75 years |
| Japanese | 97.5 /100 | #119 | Exceptional 8.3% |
| Immigrants | Asia | 97.4 /100 | #120 | Exceptional 8.3% |
| Immigrants | Croatia | 97.2 /100 | #121 | Exceptional 8.3% |
| Immigrants | Russia | 97.1 /100 | #122 | Exceptional 8.3% |
| Immigrants | Nepal | 96.9 /100 | #123 | Exceptional 8.3% |
| Thais | 96.8 /100 | #124 | Exceptional 8.3% |
| Immigrants | Moldova | 96.7 /100 | #125 | Exceptional 8.3% |
| Belizeans | 96.3 /100 | #126 | Exceptional 8.4% |
| Hondurans | 96.2 /100 | #127 | Exceptional 8.4% |
| Native Hawaiians | 96.1 /100 | #128 | Exceptional 8.4% |
| Ghanaians | 96.0 /100 | #129 | Exceptional 8.4% |
| Apache | 95.2 /100 | #130 | Exceptional 8.4% |
| German Russians | 94.9 /100 | #131 | Exceptional 8.4% |
| Chileans | 93.8 /100 | #132 | Exceptional 8.4% |
| Serbians | 93.7 /100 | #133 | Exceptional 8.4% |