Sri Lankan vs Immigrants from Dominican Republic Unemployment Among Ages 35 to 44 years

COMPARE

Sri Lankan
Race
Ancestry
AfghanAfricanAlaska NativeAlaskan AthabascanAlbanianAleutAlsatianAmericanApacheArabArapahoArgentineanArmenianAssyrian/Chaldean/SyriacAustralianAustrianBahamianBangladeshiBarbadianBasqueBelgianBelizeanBermudanBhutaneseBlackfeetBolivianBrazilianBritishBritish West IndianBulgarianBurmeseCajunCambodianCanadianCape VerdeanCarpatho RusynCelticCentral AmericanCentral American IndianCherokeeCheyenneChickasawChileanChineseChippewaChoctawColombianColvilleComancheCosta RicanCreeCreekCroatianCrowCubanCypriotCzechCzechoslovakianDanishDelawareDominicanDutchDutch West IndianEastern EuropeanEcuadorianEgyptianEnglishEstonianEthiopianEuropeanFijianFilipinoFinnishFrenchFrench American IndianFrench CanadianGermanGerman RussianGhanaianGreekGuamanian/ChamorroGuatemalanGuyaneseHaitianHmongHonduranHopiHoumaHungarianIcelanderIndian (Asian)IndonesianInupiatIranianIraqiIrishIroquoisIsraeliItalianJamaicanJapaneseJordanianKenyanKiowaKoreanLaotianLatvianLebaneseLiberianLithuanianLumbeeLuxembourgerMacedonianMalaysianMalteseMarshalleseMenomineeMexicanMexican American IndianMongolianMoroccanNative HawaiianNavajoNepaleseNew ZealanderNicaraguanNigerianNorthern EuropeanNorwegianOkinawanOsageOttawaPaiutePakistaniPalestinianPanamanianParaguayanPennsylvania GermanPeruvianPimaPolishPortuguesePotawatomiPuebloPuerto RicanPuget Sound SalishRomanianRussianSalvadoranSamoanScandinavianScotch-IrishScottishSeminoleSenegaleseSerbianShoshoneSierra LeoneanSiouxSlavicSlovakSloveneSomaliSouth AfricanSouth AmericanSouth American IndianSoviet UnionSpaniardSpanishSpanish AmericanSpanish American IndianSri LankanSubsaharan AfricanSudaneseSwedishSwissSyrianTaiwaneseThaiTlingit-HaidaTohono O'OdhamTonganTrinidadian and TobagonianTsimshianTurkishU.S. Virgin IslanderUgandanUkrainianUruguayanUteVenezuelanVietnameseWelshWest IndianYakamaYaquiYugoslavianYumanYup'ikZimbabwean
Immigration
NonimmigrantsImmigrantsAfghanistanAfricaAlbaniaArgentinaArmeniaAsiaAustraliaAustriaBahamasBangladeshBarbadosBelarusBelgiumBelizeBoliviaBosnia and HerzegovinaBrazilBulgariaBurma/MyanmarCabo VerdeCambodiaCameroonCanadaCaribbeanCentral AmericaChileChinaColombiaCongoCosta RicaCroatiaCubaCzechoslovakiaDenmarkDominicaEastern AfricaEastern AsiaEastern EuropeEcuadorEgyptEl SalvadorEnglandEritreaEthiopiaEuropeFijiFranceGermanyGhanaGreeceGrenadaGuatemalaGuyanaHaitiHondurasHong KongHungaryIndiaIndonesiaIranIraqIrelandIsraelItalyJamaicaJapanJordanKazakhstanKenyaKoreaKuwaitLaosLatin AmericaLatviaLebanonLiberiaLithuaniaMalaysiaMexicoMicronesiaMiddle AfricaMoldovaMoroccoNepalNetherlandsNicaraguaNigeriaNorth AmericaNorth MacedoniaNorthern AfricaNorthern EuropeNorwayOceaniaPakistanPanamaPeruPhilippinesPolandPortugalRomaniaRussiaSaudi ArabiaScotlandSenegalSerbiaSierra LeoneSingaporeSomaliaSouth AfricaSouth AmericaSouth Central AsiaSouth Eastern AsiaSouthern EuropeSpainSri LankaSt. Vincent and the GrenadinesSudanSwedenSwitzerlandSyriaTaiwanThailandTrinidad and TobagoTurkeyUgandaUkraineUruguayUzbekistanVenezuelaVietnamWest IndiesWestern AfricaWestern AsiaWestern EuropeYemenZaireZimbabweAzores
Immigrants from Dominican Republic
Race
Ancestry
AfghanAfricanAlaska NativeAlaskan AthabascanAlbanianAleutAlsatianAmericanApacheArabArapahoArgentineanArmenianAssyrian/Chaldean/SyriacAustralianAustrianBahamianBangladeshiBarbadianBasqueBelgianBelizeanBermudanBhutaneseBlackfeetBolivianBrazilianBritishBritish West IndianBulgarianBurmeseCajunCambodianCanadianCape VerdeanCarpatho RusynCelticCentral AmericanCentral American IndianCherokeeCheyenneChickasawChileanChineseChippewaChoctawColombianColvilleComancheCosta RicanCreeCreekCroatianCrowCubanCypriotCzechCzechoslovakianDanishDelawareDominicanDutchDutch West IndianEastern EuropeanEcuadorianEgyptianEnglishEstonianEthiopianEuropeanFijianFilipinoFinnishFrenchFrench American IndianFrench CanadianGermanGerman RussianGhanaianGreekGuamanian/ChamorroGuatemalanGuyaneseHaitianHmongHonduranHopiHoumaHungarianIcelanderIndian (Asian)IndonesianInupiatIranianIraqiIrishIroquoisIsraeliItalianJamaicanJapaneseJordanianKenyanKiowaKoreanLaotianLatvianLebaneseLiberianLithuanianLumbeeLuxembourgerMacedonianMalaysianMalteseMarshalleseMenomineeMexicanMexican American IndianMongolianMoroccanNative HawaiianNavajoNepaleseNew ZealanderNicaraguanNigerianNorthern EuropeanNorwegianOkinawanOsageOttawaPaiutePakistaniPalestinianPanamanianParaguayanPennsylvania GermanPeruvianPimaPolishPortuguesePotawatomiPuebloPuerto RicanPuget Sound SalishRomanianRussianSalvadoranSamoanScandinavianScotch-IrishScottishSeminoleSenegaleseSerbianShoshoneSierra LeoneanSiouxSlavicSlovakSloveneSomaliSouth AfricanSouth AmericanSouth American IndianSoviet UnionSpaniardSpanishSpanish AmericanSpanish American IndianSubsaharan AfricanSudaneseSwedishSwissSyrianTaiwaneseThaiTlingit-HaidaTohono O'OdhamTonganTrinidadian and TobagonianTsimshianTurkishU.S. Virgin IslanderUgandanUkrainianUruguayanUteVenezuelanVietnameseWelshWest IndianYakamaYaquiYugoslavianYumanYup'ikZimbabwean
Immigration
NonimmigrantsImmigrantsAfghanistanAfricaAlbaniaArgentinaArmeniaAsiaAustraliaAustriaBahamasBangladeshBarbadosBelarusBelgiumBelizeBoliviaBosnia and HerzegovinaBrazilBulgariaBurma/MyanmarCabo VerdeCambodiaCameroonCanadaCaribbeanCentral AmericaChileChinaColombiaCongoCosta RicaCroatiaCubaCzechoslovakiaDenmarkDominicaDominican RepublicEastern AfricaEastern AsiaEastern EuropeEcuadorEgyptEl SalvadorEnglandEritreaEthiopiaEuropeFijiFranceGermanyGhanaGreeceGrenadaGuatemalaGuyanaHaitiHondurasHong KongHungaryIndiaIndonesiaIranIraqIrelandIsraelItalyJamaicaJapanJordanKazakhstanKenyaKoreaKuwaitLaosLatin AmericaLatviaLebanonLiberiaLithuaniaMalaysiaMexicoMicronesiaMiddle AfricaMoldovaMoroccoNepalNetherlandsNicaraguaNigeriaNorth AmericaNorth MacedoniaNorthern AfricaNorthern EuropeNorwayOceaniaPakistanPanamaPeruPhilippinesPolandPortugalRomaniaRussiaSaudi ArabiaScotlandSenegalSerbiaSierra LeoneSingaporeSomaliaSouth AfricaSouth AmericaSouth Central AsiaSouth Eastern AsiaSouthern EuropeSpainSri LankaSt. Vincent and the GrenadinesSudanSwedenSwitzerlandSyriaTaiwanThailandTrinidad and TobagoTurkeyUgandaUkraineUruguayUzbekistanVenezuelaVietnamWest IndiesWestern AfricaWestern AsiaWestern EuropeYemenZaireZimbabweAzores
Unemployment Among Ages 35 to 44 years
Income
Poverty
Unemployment
Labor Participation
Family Structure
Vehicle Availability
Education Level
Disability

Unemployment Among Ages 35 to 44 years Comparison

Sri Lankans

Immigrants from Dominican Republic

Excellent
Tragic
4.5%
UNEMPLOYMENT AMONG AGES 35 TO 44 YEARS
86.8/ 100
METRIC RATING
122nd/ 347
METRIC RANK
6.4%
UNEMPLOYMENT AMONG AGES 35 TO 44 YEARS
0.0/ 100
METRIC RATING
322nd/ 347
METRIC RANK

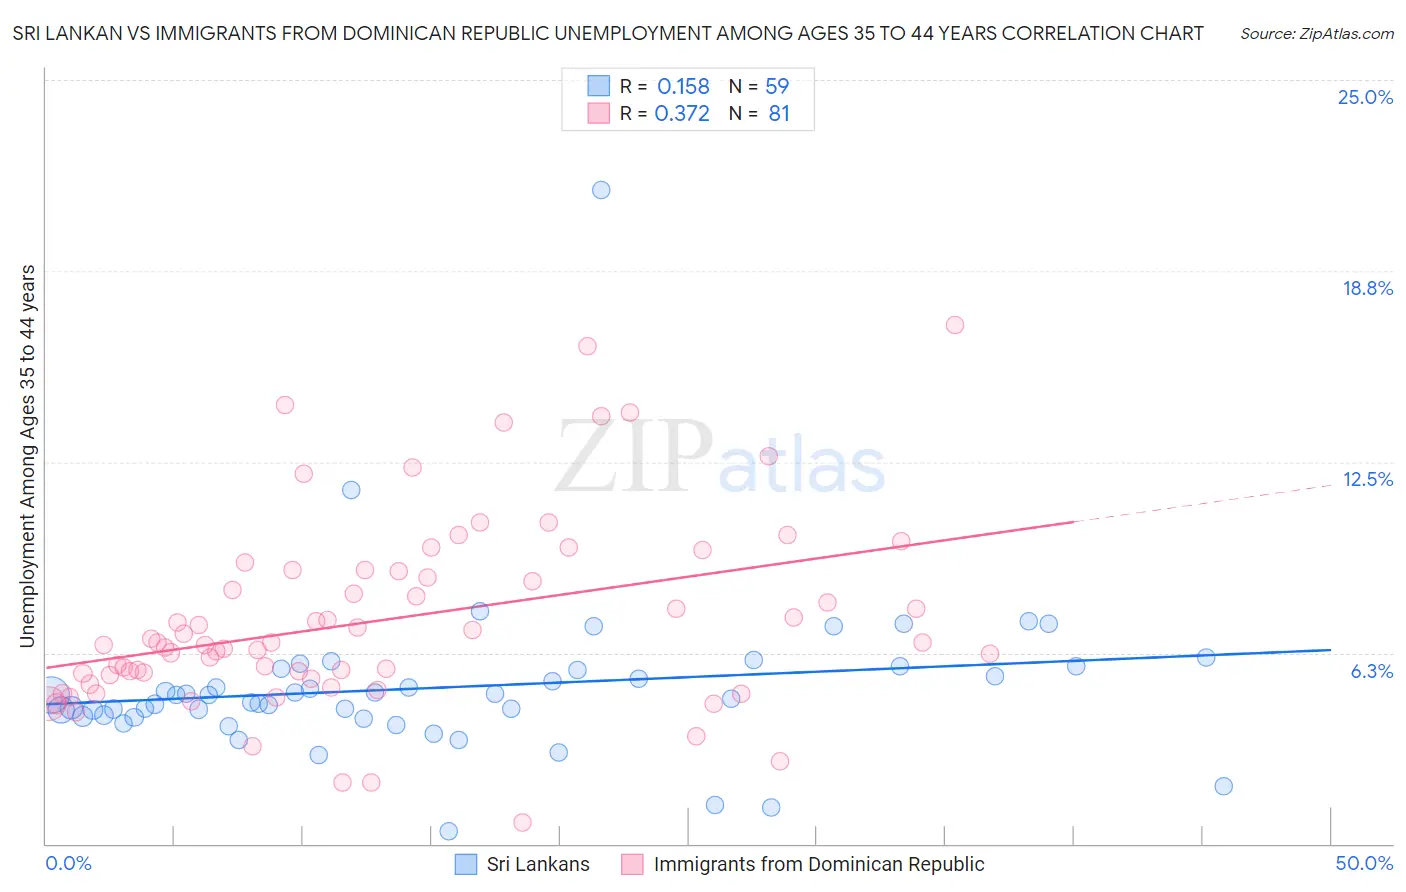
Sri Lankan vs Immigrants from Dominican Republic Unemployment Among Ages 35 to 44 years Correlation Chart

The statistical analysis conducted on geographies consisting of 429,668,170 people shows a poor positive correlation between the proportion of Sri Lankans and unemployment rate among population between the ages 35 and 44 in the United States with a correlation coefficient (R) of 0.158 and weighted average of 4.5%. Similarly, the statistical analysis conducted on geographies consisting of 270,621,781 people shows a mild positive correlation between the proportion of Immigrants from Dominican Republic and unemployment rate among population between the ages 35 and 44 in the United States with a correlation coefficient (R) of 0.372 and weighted average of 6.4%, a difference of 41.7%.
Sri Lankan vs Immigrants from Dominican Republic Unemployment Among Ages 35 to 44 years

Unemployment Among Ages 35 to 44 years Correlation Summary

MeasurementSri LankanImmigrants from Dominican Republic
Minimum0.40%0.70%
Maximum21.4%17.0%
Range21.0%16.3%
Mean5.1%7.3%
Median4.9%6.6%
Interquartile 25% (IQ1)4.2%5.5%
Interquartile 75% (IQ3)5.7%8.9%
Interquartile Range (IQR)1.6%3.5%
Standard Deviation (Sample)2.7%3.1%
Standard Deviation (Population)2.7%3.1%

Similar Demographics by Unemployment Among Ages 35 to 44 years

Demographics Similar to Sri Lankans by Unemployment Among Ages 35 to 44 years

In terms of unemployment among ages 35 to 44 years, the demographic groups most similar to Sri Lankans are Immigrants from South Africa (4.5%, a difference of 0.0%), Ethiopian (4.5%, a difference of 0.050%), Basque (4.5%, a difference of 0.080%), Immigrants from Spain (4.5%, a difference of 0.11%), and Immigrants from Northern Africa (4.5%, a difference of 0.11%).
DemographicsRating | RankUnemployment Among Ages 35 to 44 years
Maltese
88.1
/100
|
#115
Excellent
4.5%
Immigrants | Israel
88.1
/100
|
#116
Excellent
4.5%
Immigrants | Greece
87.9
/100
|
#117
Excellent
4.5%
Irish
87.9
/100
|
#118
Excellent
4.5%
Nicaraguans
87.6
/100
|
#119
Excellent
4.5%
Ethiopians
87.1
/100
|
#120
Excellent
4.5%
Immigrants | South Africa
86.8
/100
|
#121
Excellent
4.5%
Sri Lankans
86.8
/100
|
#122
Excellent
4.5%
Basques
86.3
/100
|
#123
Excellent
4.5%
Immigrants | Spain
86.1
/100
|
#124
Excellent
4.5%
Immigrants | Northern Africa
86.1
/100
|
#125
Excellent
4.5%
Immigrants | Austria
84.7
/100
|
#126
Excellent
4.5%
Immigrants | Ethiopia
84.7
/100
|
#127
Excellent
4.5%
Czechoslovakians
83.4
/100
|
#128
Excellent
4.6%
Immigrants | Croatia
83.1
/100
|
#129
Excellent
4.6%

Demographics Similar to Immigrants from Dominican Republic by Unemployment Among Ages 35 to 44 years

In terms of unemployment among ages 35 to 44 years, the demographic groups most similar to Immigrants from Dominican Republic are Dominican (6.4%, a difference of 0.080%), Menominee (6.5%, a difference of 1.7%), Immigrants from Yemen (6.6%, a difference of 2.0%), Alaska Native (6.6%, a difference of 2.1%), and Cape Verdean (6.6%, a difference of 2.2%).
DemographicsRating | RankUnemployment Among Ages 35 to 44 years
Blacks/African Americans
0.0
/100
|
#315
Tragic
6.1%
Tsimshian
0.0
/100
|
#316
Tragic
6.2%
Immigrants | St. Vincent and the Grenadines
0.0
/100
|
#317
Tragic
6.2%
Colville
0.0
/100
|
#318
Tragic
6.2%
Immigrants | Grenada
0.0
/100
|
#319
Tragic
6.2%
Immigrants | Armenia
0.0
/100
|
#320
Tragic
6.2%
Chippewa
0.0
/100
|
#321
Tragic
6.2%
Immigrants | Dominican Republic
0.0
/100
|
#322
Tragic
6.4%
Dominicans
0.0
/100
|
#323
Tragic
6.4%
Menominee
0.0
/100
|
#324
Tragic
6.5%
Immigrants | Yemen
0.0
/100
|
#325
Tragic
6.6%
Alaska Natives
0.0
/100
|
#326
Tragic
6.6%
Cape Verdeans
0.0
/100
|
#327
Tragic
6.6%
Shoshone
0.0
/100
|
#328
Tragic
6.6%
Paiute
0.0
/100
|
#329
Tragic
6.9%