Spanish vs Swiss Female Unemployment

COMPARE

Spanish
Race
Ancestry
AfghanAfricanAlaska NativeAlaskan AthabascanAlbanianAleutAlsatianAmericanApacheArabArapahoArgentineanArmenianAssyrian/Chaldean/SyriacAustralianAustrianBahamianBangladeshiBarbadianBasqueBelgianBelizeanBermudanBhutaneseBlackfeetBolivianBrazilianBritishBritish West IndianBulgarianBurmeseCajunCambodianCanadianCape VerdeanCarpatho RusynCelticCentral AmericanCentral American IndianCherokeeCheyenneChickasawChileanChineseChippewaChoctawColombianColvilleComancheCosta RicanCreeCreekCroatianCrowCubanCypriotCzechCzechoslovakianDanishDelawareDominicanDutchDutch West IndianEastern EuropeanEcuadorianEgyptianEnglishEstonianEthiopianEuropeanFijianFilipinoFinnishFrenchFrench American IndianFrench CanadianGermanGerman RussianGhanaianGreekGuamanian/ChamorroGuatemalanGuyaneseHaitianHmongHonduranHopiHoumaHungarianIcelanderIndian (Asian)IndonesianInupiatIranianIraqiIrishIroquoisIsraeliItalianJamaicanJapaneseJordanianKenyanKiowaKoreanLaotianLatvianLebaneseLiberianLithuanianLumbeeLuxembourgerMacedonianMalaysianMalteseMarshalleseMenomineeMexicanMexican American IndianMongolianMoroccanNative HawaiianNavajoNepaleseNew ZealanderNicaraguanNigerianNorthern EuropeanNorwegianOkinawanOsageOttawaPaiutePakistaniPalestinianPanamanianParaguayanPennsylvania GermanPeruvianPimaPolishPortuguesePotawatomiPuebloPuerto RicanPuget Sound SalishRomanianRussianSalvadoranSamoanScandinavianScotch-IrishScottishSeminoleSenegaleseSerbianShoshoneSierra LeoneanSiouxSlavicSlovakSloveneSomaliSouth AfricanSouth AmericanSouth American IndianSoviet UnionSpaniardSpanishSpanish AmericanSpanish American IndianSri LankanSubsaharan AfricanSudaneseSwedishSyrianTaiwaneseThaiTlingit-HaidaTohono O'OdhamTonganTrinidadian and TobagonianTsimshianTurkishU.S. Virgin IslanderUgandanUkrainianUruguayanUteVenezuelanVietnameseWelshWest IndianYakamaYaquiYugoslavianYumanYup'ikZimbabwean
Immigration
NonimmigrantsImmigrantsAfghanistanAfricaAlbaniaArgentinaArmeniaAsiaAustraliaAustriaBahamasBangladeshBarbadosBelarusBelgiumBelizeBoliviaBosnia and HerzegovinaBrazilBulgariaBurma/MyanmarCabo VerdeCambodiaCameroonCanadaCaribbeanCentral AmericaChileChinaColombiaCongoCosta RicaCroatiaCubaCzechoslovakiaDenmarkDominicaDominican RepublicEastern AfricaEastern AsiaEastern EuropeEcuadorEgyptEl SalvadorEnglandEritreaEthiopiaEuropeFijiFranceGermanyGhanaGreeceGrenadaGuatemalaGuyanaHaitiHondurasHong KongHungaryIndiaIndonesiaIranIraqIrelandIsraelItalyJamaicaJapanJordanKazakhstanKenyaKoreaKuwaitLaosLatin AmericaLatviaLebanonLiberiaLithuaniaMalaysiaMexicoMicronesiaMiddle AfricaMoldovaMoroccoNepalNetherlandsNicaraguaNigeriaNorth AmericaNorth MacedoniaNorthern AfricaNorthern EuropeNorwayOceaniaPakistanPanamaPeruPhilippinesPolandPortugalRomaniaRussiaSaudi ArabiaScotlandSenegalSerbiaSierra LeoneSingaporeSomaliaSouth AfricaSouth AmericaSouth Central AsiaSouth Eastern AsiaSouthern EuropeSpainSri LankaSt. Vincent and the GrenadinesSudanSwedenSwitzerlandSyriaTaiwanThailandTrinidad and TobagoTurkeyUgandaUkraineUruguayUzbekistanVenezuelaVietnamWest IndiesWestern AfricaWestern AsiaWestern EuropeYemenZaireZimbabweAzores
Swiss
Race
Ancestry
AfghanAfricanAlaska NativeAlaskan AthabascanAlbanianAleutAlsatianAmericanApacheArabArapahoArgentineanArmenianAssyrian/Chaldean/SyriacAustralianAustrianBahamianBangladeshiBarbadianBasqueBelgianBelizeanBermudanBhutaneseBlackfeetBolivianBrazilianBritishBritish West IndianBulgarianBurmeseCajunCambodianCanadianCape VerdeanCarpatho RusynCelticCentral AmericanCentral American IndianCherokeeCheyenneChickasawChileanChineseChippewaChoctawColombianColvilleComancheCosta RicanCreeCreekCroatianCrowCubanCypriotCzechCzechoslovakianDanishDelawareDominicanDutchDutch West IndianEastern EuropeanEcuadorianEgyptianEnglishEstonianEthiopianEuropeanFijianFilipinoFinnishFrenchFrench American IndianFrench CanadianGermanGerman RussianGhanaianGreekGuamanian/ChamorroGuatemalanGuyaneseHaitianHmongHonduranHopiHoumaHungarianIcelanderIndian (Asian)IndonesianInupiatIranianIraqiIrishIroquoisIsraeliItalianJamaicanJapaneseJordanianKenyanKiowaKoreanLaotianLatvianLebaneseLiberianLithuanianLumbeeLuxembourgerMacedonianMalaysianMalteseMarshalleseMenomineeMexicanMexican American IndianMongolianMoroccanNative HawaiianNavajoNepaleseNew ZealanderNicaraguanNigerianNorthern EuropeanNorwegianOkinawanOsageOttawaPaiutePakistaniPalestinianPanamanianParaguayanPennsylvania GermanPeruvianPimaPolishPortuguesePotawatomiPuebloPuerto RicanPuget Sound SalishRomanianRussianSalvadoranSamoanScandinavianScotch-IrishScottishSeminoleSenegaleseSerbianShoshoneSierra LeoneanSiouxSlavicSlovakSloveneSomaliSouth AfricanSouth AmericanSouth American IndianSoviet UnionSpaniardSpanish AmericanSpanish American IndianSri LankanSubsaharan AfricanSudaneseSwedishSwissSyrianTaiwaneseThaiTlingit-HaidaTohono O'OdhamTonganTrinidadian and TobagonianTsimshianTurkishU.S. Virgin IslanderUgandanUkrainianUruguayanUteVenezuelanVietnameseWelshWest IndianYakamaYaquiYugoslavianYumanYup'ikZimbabwean
Immigration
NonimmigrantsImmigrantsAfghanistanAfricaAlbaniaArgentinaArmeniaAsiaAustraliaAustriaBahamasBangladeshBarbadosBelarusBelgiumBelizeBoliviaBosnia and HerzegovinaBrazilBulgariaBurma/MyanmarCabo VerdeCambodiaCameroonCanadaCaribbeanCentral AmericaChileChinaColombiaCongoCosta RicaCroatiaCubaCzechoslovakiaDenmarkDominicaDominican RepublicEastern AfricaEastern AsiaEastern EuropeEcuadorEgyptEl SalvadorEnglandEritreaEthiopiaEuropeFijiFranceGermanyGhanaGreeceGrenadaGuatemalaGuyanaHaitiHondurasHong KongHungaryIndiaIndonesiaIranIraqIrelandIsraelItalyJamaicaJapanJordanKazakhstanKenyaKoreaKuwaitLaosLatin AmericaLatviaLebanonLiberiaLithuaniaMalaysiaMexicoMicronesiaMiddle AfricaMoldovaMoroccoNepalNetherlandsNicaraguaNigeriaNorth AmericaNorth MacedoniaNorthern AfricaNorthern EuropeNorwayOceaniaPakistanPanamaPeruPhilippinesPolandPortugalRomaniaRussiaSaudi ArabiaScotlandSenegalSerbiaSierra LeoneSingaporeSomaliaSouth AfricaSouth AmericaSouth Central AsiaSouth Eastern AsiaSouthern EuropeSpainSri LankaSt. Vincent and the GrenadinesSudanSwedenSwitzerlandSyriaTaiwanThailandTrinidad and TobagoTurkeyUgandaUkraineUruguayUzbekistanVenezuelaVietnamWest IndiesWestern AfricaWestern AsiaWestern EuropeYemenZaireZimbabweAzores
Female Unemployment
Income
Poverty
Unemployment
Labor Participation
Family Structure
Vehicle Availability
Education Level
Disability

Female Unemployment Comparison

Spanish

Swiss

Average
Exceptional
5.2%
FEMALE UNEMPLOYMENT
55.9/ 100
METRIC RATING
170th/ 347
METRIC RANK
4.6%
FEMALE UNEMPLOYMENT
100.0/ 100
METRIC RATING
10th/ 347
METRIC RANK

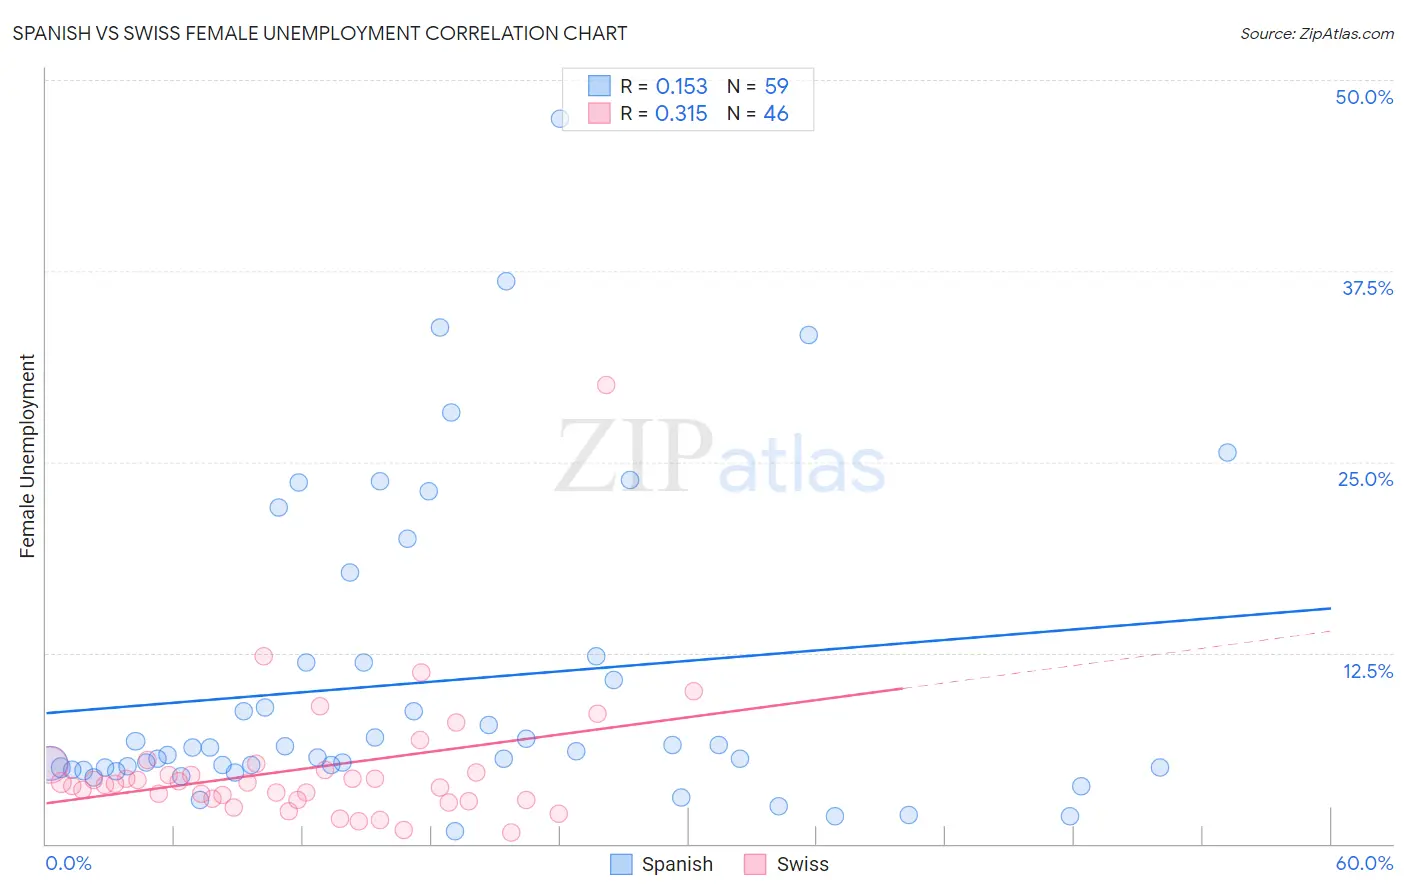
Spanish vs Swiss Female Unemployment Correlation Chart

The statistical analysis conducted on geographies consisting of 419,412,543 people shows a poor positive correlation between the proportion of Spanish and unemploymnet rate among females in the United States with a correlation coefficient (R) of 0.153 and weighted average of 5.2%. Similarly, the statistical analysis conducted on geographies consisting of 458,890,724 people shows a mild positive correlation between the proportion of Swiss and unemploymnet rate among females in the United States with a correlation coefficient (R) of 0.315 and weighted average of 4.6%, a difference of 14.9%.
Spanish vs Swiss Female Unemployment

Female Unemployment Correlation Summary

MeasurementSpanishSwiss
Minimum0.80%0.70%
Maximum47.5%30.0%
Range46.7%29.3%
Mean10.6%4.9%
Median6.1%4.0%
Interquartile 25% (IQ1)5.0%2.9%
Interquartile 75% (IQ3)11.9%4.8%
Interquartile Range (IQR)6.9%1.9%
Standard Deviation (Sample)10.1%4.5%
Standard Deviation (Population)10.0%4.5%

Similar Demographics by Female Unemployment

Demographics Similar to Spanish by Female Unemployment

In terms of female unemployment, the demographic groups most similar to Spanish are Immigrants from Denmark (5.2%, a difference of 0.050%), Immigrants from Chile (5.2%, a difference of 0.19%), Sri Lankan (5.2%, a difference of 0.22%), Immigrants from Uganda (5.3%, a difference of 0.31%), and Iranian (5.3%, a difference of 0.33%).
DemographicsRating | RankFemale Unemployment
Immigrants | Asia
64.3
/100
|
#163
Good
5.2%
Bangladeshis
64.3
/100
|
#164
Good
5.2%
Syrians
62.8
/100
|
#165
Good
5.2%
Native Hawaiians
62.7
/100
|
#166
Good
5.2%
Immigrants | Thailand
62.1
/100
|
#167
Good
5.2%
Sri Lankans
59.4
/100
|
#168
Average
5.2%
Immigrants | Chile
59.0
/100
|
#169
Average
5.2%
Spanish
55.9
/100
|
#170
Average
5.2%
Immigrants | Denmark
55.0
/100
|
#171
Average
5.2%
Immigrants | Uganda
50.7
/100
|
#172
Average
5.3%
Iranians
50.4
/100
|
#173
Average
5.3%
Immigrants | Poland
50.0
/100
|
#174
Average
5.3%
Immigrants | Laos
47.5
/100
|
#175
Average
5.3%
Immigrants | Vietnam
47.5
/100
|
#176
Average
5.3%
Immigrants | Morocco
47.4
/100
|
#177
Average
5.3%

Demographics Similar to Swiss by Female Unemployment

In terms of female unemployment, the demographic groups most similar to Swiss are Scandinavian (4.6%, a difference of 0.11%), Dutch (4.6%, a difference of 0.71%), Belgian (4.6%, a difference of 0.86%), Slovene (4.5%, a difference of 1.3%), and Finnish (4.6%, a difference of 1.5%).
DemographicsRating | RankFemale Unemployment
Luxembourgers
100.0
/100
|
#3
Exceptional
4.4%
Danes
100.0
/100
|
#4
Exceptional
4.4%
Hmong
100.0
/100
|
#5
Exceptional
4.4%
Swedes
100.0
/100
|
#6
Exceptional
4.4%
Chinese
100.0
/100
|
#7
Exceptional
4.5%
Germans
100.0
/100
|
#8
Exceptional
4.5%
Slovenes
100.0
/100
|
#9
Exceptional
4.5%
Swiss
100.0
/100
|
#10
Exceptional
4.6%
Scandinavians
100.0
/100
|
#11
Exceptional
4.6%
Dutch
100.0
/100
|
#12
Exceptional
4.6%
Belgians
100.0
/100
|
#13
Exceptional
4.6%
Finns
100.0
/100
|
#14
Exceptional
4.6%
English
100.0
/100
|
#15
Exceptional
4.6%
Carpatho Rusyns
99.9
/100
|
#16
Exceptional
4.7%
Croatians
99.9
/100
|
#17
Exceptional
4.7%