Spanish American Indian vs Tlingit-Haida Unemployment Among Seniors over 65 years
COMPARE
Spanish American Indian
Tlingit-Haida
Unemployment Among Seniors over 65 years
Unemployment Among Seniors over 65 years Comparison
Spanish American Indians
Tlingit-Haida
5.4%
UNEMPLOYMENT AMONG SENIORS OVER 65 YEARS
0.2/ 100
METRIC RATING
261st/ 347
METRIC RANK
6.8%
UNEMPLOYMENT AMONG SENIORS OVER 65 YEARS
0.0/ 100
METRIC RATING
343rd/ 347
METRIC RANK
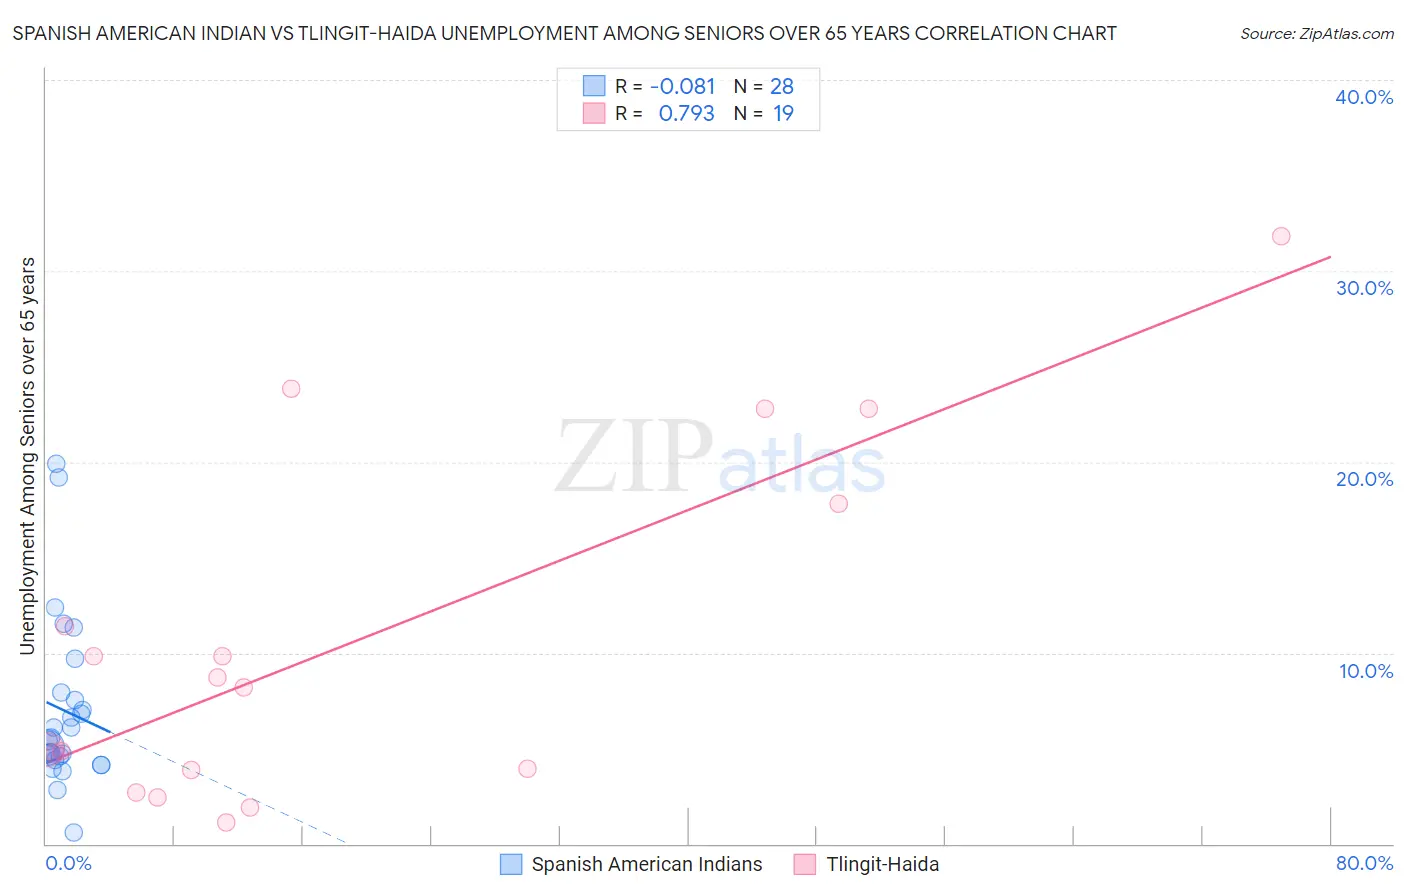
Spanish American Indian vs Tlingit-Haida Unemployment Among Seniors over 65 years Correlation Chart
The statistical analysis conducted on geographies consisting of 71,518,154 people shows a slight negative correlation between the proportion of Spanish American Indians and unemployment rate amomg seniors over the age of 65 in the United States with a correlation coefficient (R) of -0.081 and weighted average of 5.4%. Similarly, the statistical analysis conducted on geographies consisting of 57,782,692 people shows a strong positive correlation between the proportion of Tlingit-Haida and unemployment rate amomg seniors over the age of 65 in the United States with a correlation coefficient (R) of 0.793 and weighted average of 6.8%, a difference of 25.9%.
Unemployment Among Seniors over 65 years Correlation Summary
| Measurement | Spanish American Indian | Tlingit-Haida |
| Minimum | 0.60% | 1.1% |
| Maximum | 19.9% | 31.8% |
| Range | 19.3% | 30.7% |
| Mean | 7.0% | 10.4% |
| Median | 5.5% | 8.2% |
| Interquartile 25% (IQ1) | 4.5% | 3.8% |
| Interquartile 75% (IQ3) | 7.7% | 17.8% |
| Interquartile Range (IQR) | 3.2% | 14.0% |
| Standard Deviation (Sample) | 4.4% | 9.0% |
| Standard Deviation (Population) | 4.3% | 8.8% |
Similar Demographics by Unemployment Among Seniors over 65 years
Demographics Similar to Spanish American Indians by Unemployment Among Seniors over 65 years
In terms of unemployment among seniors over 65 years, the demographic groups most similar to Spanish American Indians are Immigrants from Grenada (5.4%, a difference of 0.070%), Native Hawaiian (5.4%, a difference of 0.080%), South American (5.4%, a difference of 0.12%), Central American Indian (5.4%, a difference of 0.24%), and Immigrants from Colombia (5.4%, a difference of 0.25%).
| Demographics | Rating | Rank | Unemployment Among Seniors over 65 years |
| Paraguayans | 0.5 /100 | #254 | Tragic 5.4% |
| Immigrants | Peru | 0.5 /100 | #255 | Tragic 5.4% |
| Moroccans | 0.5 /100 | #256 | Tragic 5.4% |
| Immigrants | Micronesia | 0.4 /100 | #257 | Tragic 5.4% |
| Sierra Leoneans | 0.4 /100 | #258 | Tragic 5.4% |
| Immigrants | Ghana | 0.4 /100 | #259 | Tragic 5.4% |
| Native Hawaiians | 0.3 /100 | #260 | Tragic 5.4% |
| Spanish American Indians | 0.2 /100 | #261 | Tragic 5.4% |
| Immigrants | Grenada | 0.2 /100 | #262 | Tragic 5.4% |
| South Americans | 0.2 /100 | #263 | Tragic 5.4% |
| Central American Indians | 0.2 /100 | #264 | Tragic 5.4% |
| Immigrants | Colombia | 0.2 /100 | #265 | Tragic 5.4% |
| Pennsylvania Germans | 0.2 /100 | #266 | Tragic 5.4% |
| Chippewa | 0.2 /100 | #267 | Tragic 5.4% |
| Hawaiians | 0.1 /100 | #268 | Tragic 5.4% |
Demographics Similar to Tlingit-Haida by Unemployment Among Seniors over 65 years
In terms of unemployment among seniors over 65 years, the demographic groups most similar to Tlingit-Haida are Navajo (6.7%, a difference of 1.3%), Yakama (6.7%, a difference of 1.8%), Alaskan Athabascan (7.0%, a difference of 3.8%), Ute (6.3%, a difference of 7.2%), and Paiute (6.3%, a difference of 7.3%).
| Demographics | Rating | Rank | Unemployment Among Seniors over 65 years |
| Immigrants | Dominican Republic | 0.0 /100 | #333 | Tragic 6.0% |
| Tohono O'odham | 0.0 /100 | #334 | Tragic 6.1% |
| Immigrants | Armenia | 0.0 /100 | #335 | Tragic 6.2% |
| Pima | 0.0 /100 | #336 | Tragic 6.3% |
| Alaska Natives | 0.0 /100 | #337 | Tragic 6.3% |
| Immigrants | Azores | 0.0 /100 | #338 | Tragic 6.3% |
| Paiute | 0.0 /100 | #339 | Tragic 6.3% |
| Ute | 0.0 /100 | #340 | Tragic 6.3% |
| Yakama | 0.0 /100 | #341 | Tragic 6.7% |
| Navajo | 0.0 /100 | #342 | Tragic 6.7% |
| Tlingit-Haida | 0.0 /100 | #343 | Tragic 6.8% |
| Alaskan Athabascans | 0.0 /100 | #344 | Tragic 7.0% |
| Immigrants | Yemen | 0.0 /100 | #345 | Tragic 8.2% |
| Yup'ik | 0.0 /100 | #346 | Tragic 9.1% |
| Crow | 0.0 /100 | #347 | Tragic 16.9% |