Spanish American Indian vs Immigrants from Spain Unemployment Among Seniors over 75 years
COMPARE
Spanish American Indian
Immigrants from Spain
Unemployment Among Seniors over 75 years
Unemployment Among Seniors over 75 years Comparison
Spanish American Indians
Immigrants from Spain
6.5%
UNEMPLOYMENT AMONG SENIORS OVER 75 YEARS
100.0/ 100
METRIC RATING
7th/ 347
METRIC RANK
7.8%
UNEMPLOYMENT AMONG SENIORS OVER 75 YEARS
100.0/ 100
METRIC RATING
44th/ 347
METRIC RANK
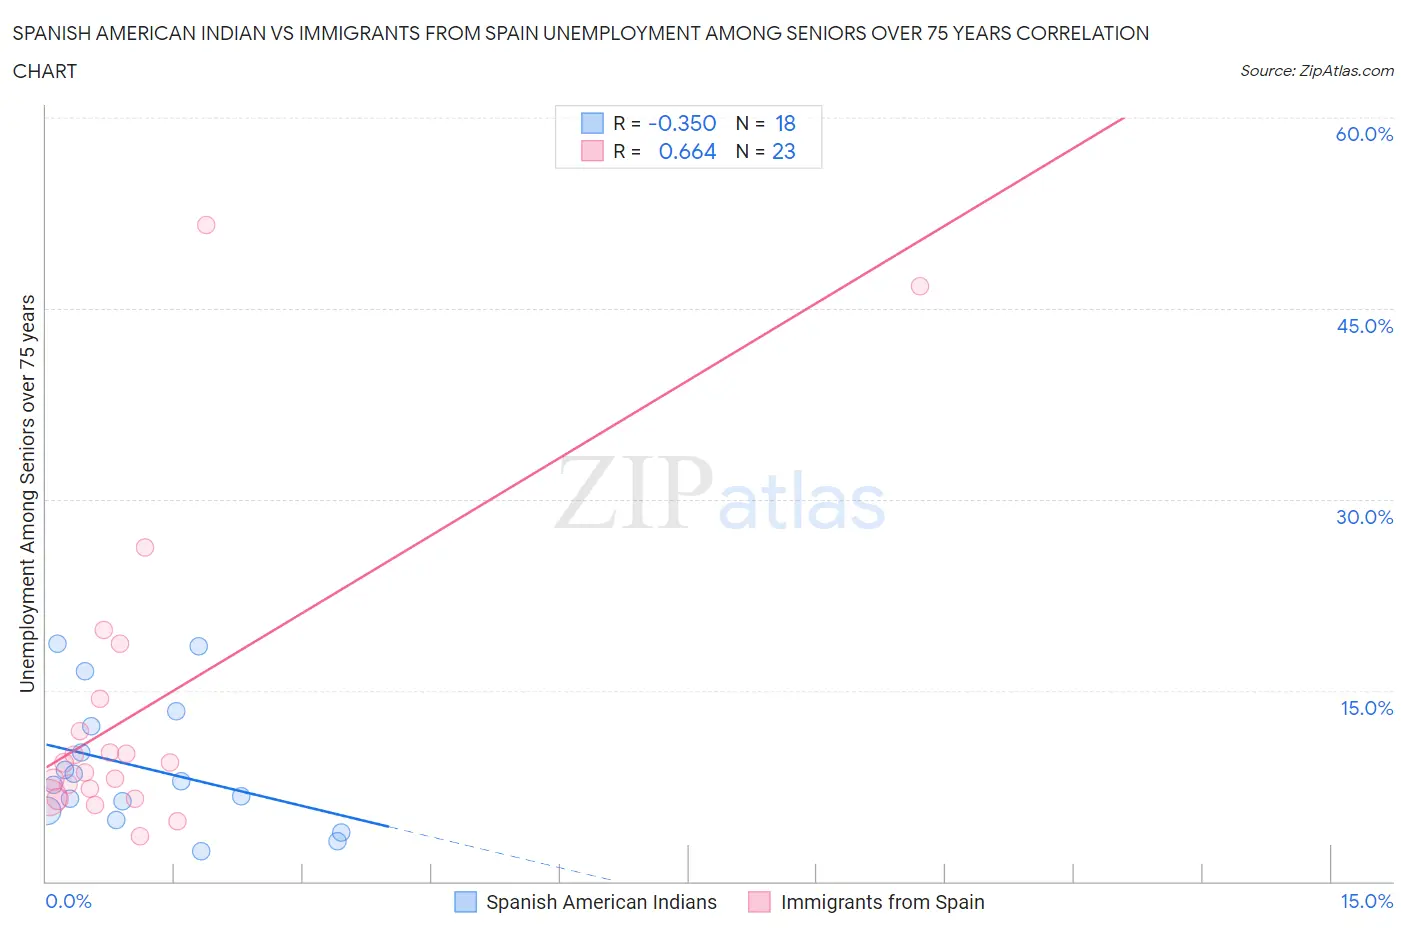
Spanish American Indian vs Immigrants from Spain Unemployment Among Seniors over 75 years Correlation Chart
The statistical analysis conducted on geographies consisting of 58,085,888 people shows a mild negative correlation between the proportion of Spanish American Indians and unemployment rate among seniors over the age of 75 in the United States with a correlation coefficient (R) of -0.350 and weighted average of 6.5%. Similarly, the statistical analysis conducted on geographies consisting of 145,232,971 people shows a significant positive correlation between the proportion of Immigrants from Spain and unemployment rate among seniors over the age of 75 in the United States with a correlation coefficient (R) of 0.664 and weighted average of 7.8%, a difference of 18.8%.
Unemployment Among Seniors over 75 years Correlation Summary
| Measurement | Spanish American Indian | Immigrants from Spain |
| Minimum | 2.4% | 3.6% |
| Maximum | 18.6% | 51.6% |
| Range | 16.2% | 48.0% |
| Mean | 9.0% | 13.5% |
| Median | 7.7% | 9.3% |
| Interquartile 25% (IQ1) | 5.5% | 6.6% |
| Interquartile 75% (IQ3) | 12.2% | 14.4% |
| Interquartile Range (IQR) | 6.7% | 7.8% |
| Standard Deviation (Sample) | 5.0% | 12.4% |
| Standard Deviation (Population) | 4.9% | 12.1% |
Similar Demographics by Unemployment Among Seniors over 75 years
Demographics Similar to Spanish American Indians by Unemployment Among Seniors over 75 years
In terms of unemployment among seniors over 75 years, the demographic groups most similar to Spanish American Indians are Immigrants from Armenia (6.5%, a difference of 0.39%), Taiwanese (6.6%, a difference of 0.41%), Soviet Union (6.6%, a difference of 1.7%), Yuman (6.7%, a difference of 1.9%), and Immigrants from Grenada (6.7%, a difference of 2.0%).
| Demographics | Rating | Rank | Unemployment Among Seniors over 75 years |
| Crow | 100.0 /100 | #1 | Exceptional 5.9% |
| Chinese | 100.0 /100 | #2 | Exceptional 5.9% |
| Cheyenne | 100.0 /100 | #3 | Exceptional 5.9% |
| Alsatians | 100.0 /100 | #4 | Exceptional 6.1% |
| Hopi | 100.0 /100 | #5 | Exceptional 6.3% |
| Immigrants | Armenia | 100.0 /100 | #6 | Exceptional 6.5% |
| Spanish American Indians | 100.0 /100 | #7 | Exceptional 6.5% |
| Taiwanese | 100.0 /100 | #8 | Exceptional 6.6% |
| Soviet Union | 100.0 /100 | #9 | Exceptional 6.6% |
| Yuman | 100.0 /100 | #10 | Exceptional 6.7% |
| Immigrants | Grenada | 100.0 /100 | #11 | Exceptional 6.7% |
| Comanche | 100.0 /100 | #12 | Exceptional 6.7% |
| Immigrants | Congo | 100.0 /100 | #13 | Exceptional 6.7% |
| Ute | 100.0 /100 | #14 | Exceptional 6.8% |
| Icelanders | 100.0 /100 | #15 | Exceptional 7.0% |
Demographics Similar to Immigrants from Spain by Unemployment Among Seniors over 75 years
In terms of unemployment among seniors over 75 years, the demographic groups most similar to Immigrants from Spain are British West Indian (7.8%, a difference of 0.010%), Immigrants from Denmark (7.8%, a difference of 0.040%), Immigrants from China (7.8%, a difference of 0.070%), Pueblo (7.7%, a difference of 0.33%), and Creek (7.8%, a difference of 0.48%).
| Demographics | Rating | Rank | Unemployment Among Seniors over 75 years |
| Immigrants | Hungary | 100.0 /100 | #37 | Exceptional 7.7% |
| Kiowa | 100.0 /100 | #38 | Exceptional 7.7% |
| Ugandans | 100.0 /100 | #39 | Exceptional 7.7% |
| Colville | 100.0 /100 | #40 | Exceptional 7.7% |
| Immigrants | Burma/Myanmar | 100.0 /100 | #41 | Exceptional 7.7% |
| Pueblo | 100.0 /100 | #42 | Exceptional 7.7% |
| Immigrants | Denmark | 100.0 /100 | #43 | Exceptional 7.8% |
| Immigrants | Spain | 100.0 /100 | #44 | Exceptional 7.8% |
| British West Indians | 100.0 /100 | #45 | Exceptional 7.8% |
| Immigrants | China | 100.0 /100 | #46 | Exceptional 7.8% |
| Creek | 100.0 /100 | #47 | Exceptional 7.8% |
| Immigrants | Chile | 100.0 /100 | #48 | Exceptional 7.8% |
| Potawatomi | 100.0 /100 | #49 | Exceptional 7.8% |
| Immigrants | Latvia | 100.0 /100 | #50 | Exceptional 7.8% |
| Moroccans | 100.0 /100 | #51 | Exceptional 7.8% |