Spaniard vs Jamaican Unemployment Among Youth under 25 years
COMPARE
Spaniard
Jamaican
Unemployment Among Youth under 25 years
Unemployment Among Youth under 25 years Comparison
Spaniards
Jamaicans
11.7%
UNEMPLOYMENT AMONG YOUTH UNDER 25 YEARS
39.8/ 100
METRIC RATING
180th/ 347
METRIC RANK
14.4%
UNEMPLOYMENT AMONG YOUTH UNDER 25 YEARS
0.0/ 100
METRIC RATING
314th/ 347
METRIC RANK
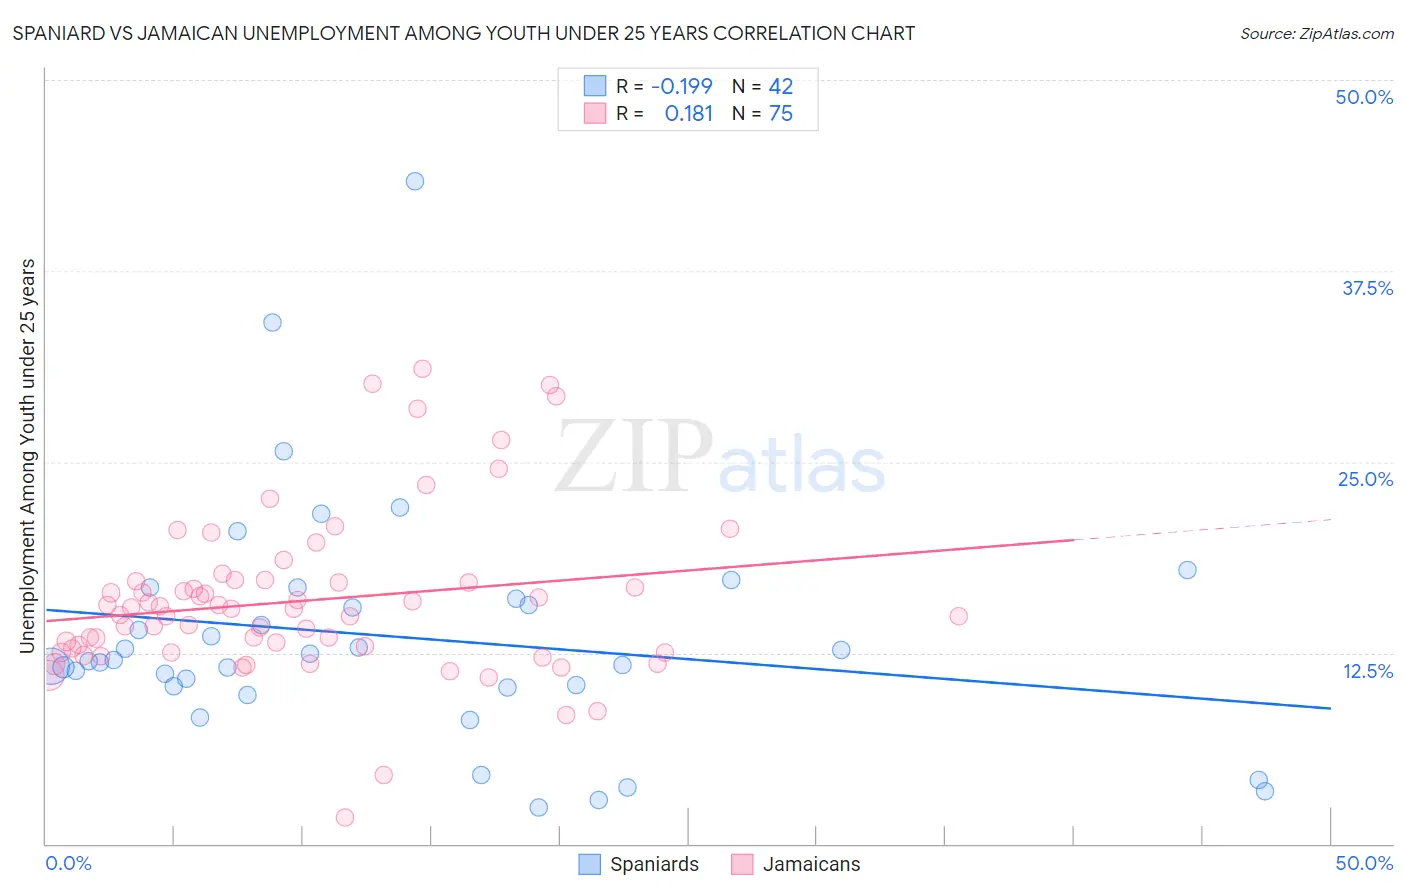
Spaniard vs Jamaican Unemployment Among Youth under 25 years Correlation Chart
The statistical analysis conducted on geographies consisting of 436,438,930 people shows a poor negative correlation between the proportion of Spaniards and unemployment rate among youth under the age of 25 in the United States with a correlation coefficient (R) of -0.199 and weighted average of 11.7%. Similarly, the statistical analysis conducted on geographies consisting of 364,456,442 people shows a poor positive correlation between the proportion of Jamaicans and unemployment rate among youth under the age of 25 in the United States with a correlation coefficient (R) of 0.181 and weighted average of 14.4%, a difference of 23.4%.
Unemployment Among Youth under 25 years Correlation Summary
| Measurement | Spaniard | Jamaican |
| Minimum | 2.4% | 1.7% |
| Maximum | 43.4% | 31.1% |
| Range | 41.0% | 29.4% |
| Mean | 13.6% | 15.9% |
| Median | 12.0% | 15.4% |
| Interquartile 25% (IQ1) | 10.3% | 12.5% |
| Interquartile 75% (IQ3) | 16.1% | 17.2% |
| Interquartile Range (IQR) | 5.8% | 4.6% |
| Standard Deviation (Sample) | 7.8% | 5.4% |
| Standard Deviation (Population) | 7.7% | 5.4% |
Similar Demographics by Unemployment Among Youth under 25 years
Demographics Similar to Spaniards by Unemployment Among Youth under 25 years
In terms of unemployment among youth under 25 years, the demographic groups most similar to Spaniards are Syrian (11.7%, a difference of 0.060%), Immigrants from Europe (11.6%, a difference of 0.11%), Immigrants from Hong Kong (11.6%, a difference of 0.11%), Immigrants from Italy (11.7%, a difference of 0.16%), and Immigrants from Denmark (11.6%, a difference of 0.22%).
| Demographics | Rating | Rank | Unemployment Among Youth under 25 years |
| Immigrants | South Eastern Asia | 51.7 /100 | #173 | Average 11.6% |
| Immigrants | China | 50.0 /100 | #174 | Average 11.6% |
| Immigrants | Iraq | 47.0 /100 | #175 | Average 11.6% |
| Ugandans | 45.6 /100 | #176 | Average 11.6% |
| Immigrants | Denmark | 45.0 /100 | #177 | Average 11.6% |
| Immigrants | Europe | 42.4 /100 | #178 | Average 11.6% |
| Immigrants | Hong Kong | 42.4 /100 | #179 | Average 11.6% |
| Spaniards | 39.8 /100 | #180 | Fair 11.7% |
| Syrians | 38.4 /100 | #181 | Fair 11.7% |
| Immigrants | Italy | 36.2 /100 | #182 | Fair 11.7% |
| Americans | 34.5 /100 | #183 | Fair 11.7% |
| Immigrants | Eastern Europe | 34.1 /100 | #184 | Fair 11.7% |
| French American Indians | 34.0 /100 | #185 | Fair 11.7% |
| Maltese | 33.9 /100 | #186 | Fair 11.7% |
| Immigrants | Egypt | 31.9 /100 | #187 | Fair 11.7% |
Demographics Similar to Jamaicans by Unemployment Among Youth under 25 years
In terms of unemployment among youth under 25 years, the demographic groups most similar to Jamaicans are Immigrants from Armenia (14.4%, a difference of 0.090%), Sioux (14.4%, a difference of 0.11%), Native/Alaskan (14.5%, a difference of 0.54%), Black/African American (14.5%, a difference of 0.63%), and Vietnamese (14.3%, a difference of 0.92%).
| Demographics | Rating | Rank | Unemployment Among Youth under 25 years |
| Immigrants | Haiti | 0.0 /100 | #307 | Tragic 14.0% |
| Immigrants | Belize | 0.0 /100 | #308 | Tragic 14.0% |
| Aleuts | 0.0 /100 | #309 | Tragic 14.1% |
| Immigrants | West Indies | 0.0 /100 | #310 | Tragic 14.2% |
| Immigrants | Bangladesh | 0.0 /100 | #311 | Tragic 14.2% |
| Vietnamese | 0.0 /100 | #312 | Tragic 14.3% |
| Immigrants | Armenia | 0.0 /100 | #313 | Tragic 14.4% |
| Jamaicans | 0.0 /100 | #314 | Tragic 14.4% |
| Sioux | 0.0 /100 | #315 | Tragic 14.4% |
| Natives/Alaskans | 0.0 /100 | #316 | Tragic 14.5% |
| Blacks/African Americans | 0.0 /100 | #317 | Tragic 14.5% |
| Immigrants | Dominica | 0.0 /100 | #318 | Tragic 14.6% |
| West Indians | 0.0 /100 | #319 | Tragic 14.6% |
| Barbadians | 0.0 /100 | #320 | Tragic 14.6% |
| Cheyenne | 0.0 /100 | #321 | Tragic 14.6% |