Soviet Union vs Northern European Unemployment Among Ages 25 to 29 years
COMPARE
Soviet Union
Northern European
Unemployment Among Ages 25 to 29 years
Unemployment Among Ages 25 to 29 years Comparison
Soviet Union
Northern Europeans
6.2%
UNEMPLOYMENT AMONG AGES 25 TO 29 YEARS
98.9/ 100
METRIC RATING
50th/ 347
METRIC RANK
6.5%
UNEMPLOYMENT AMONG AGES 25 TO 29 YEARS
75.4/ 100
METRIC RATING
136th/ 347
METRIC RANK
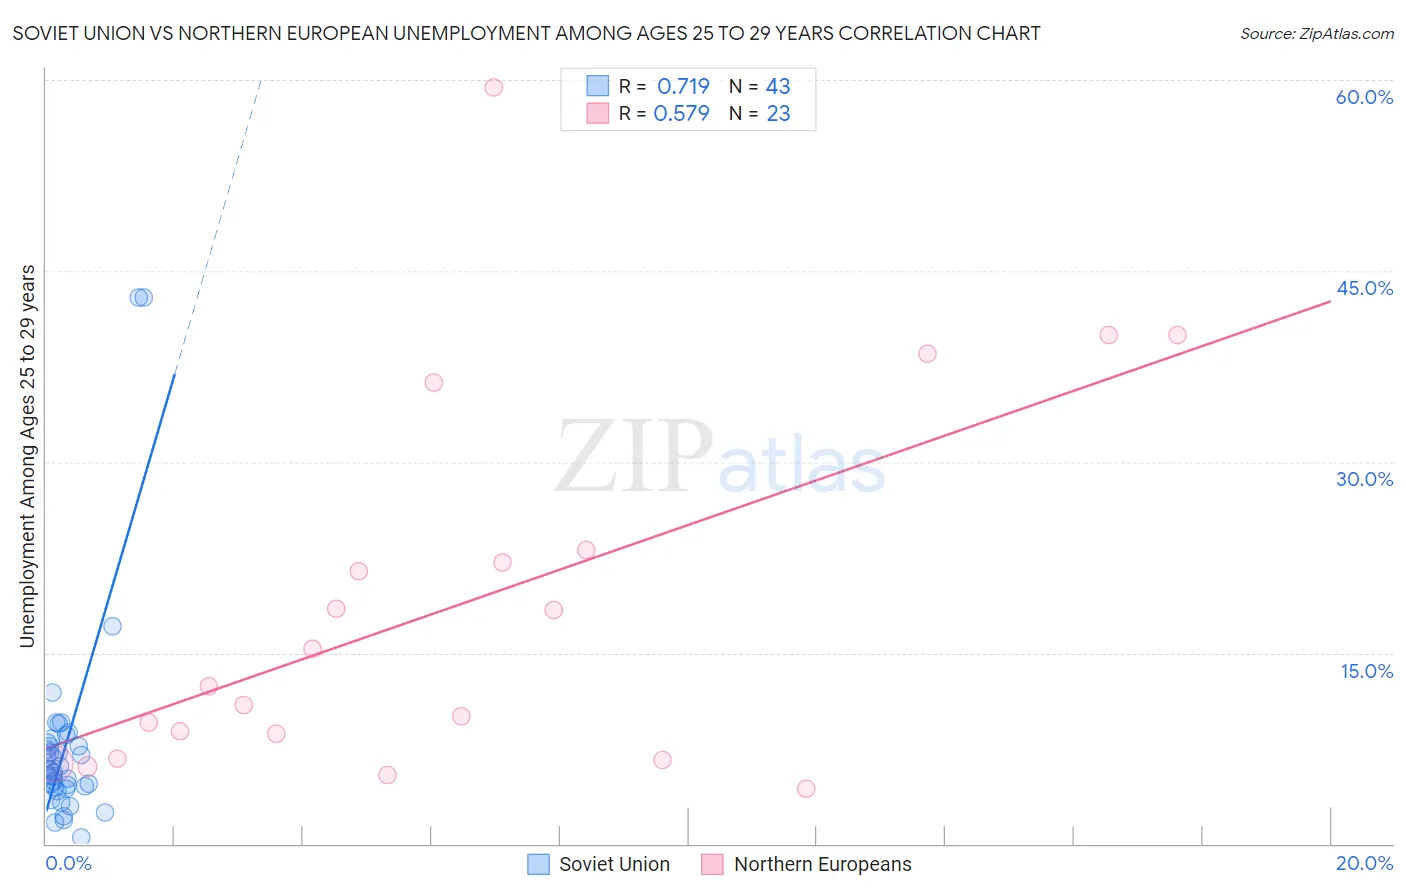
Soviet Union vs Northern European Unemployment Among Ages 25 to 29 years Correlation Chart
The statistical analysis conducted on geographies consisting of 43,269,095 people shows a strong positive correlation between the proportion of Soviet Union and unemployment rate among population between the ages 25 and 29 in the United States with a correlation coefficient (R) of 0.719 and weighted average of 6.2%. Similarly, the statistical analysis conducted on geographies consisting of 379,973,816 people shows a substantial positive correlation between the proportion of Northern Europeans and unemployment rate among population between the ages 25 and 29 in the United States with a correlation coefficient (R) of 0.579 and weighted average of 6.5%, a difference of 5.6%.
Unemployment Among Ages 25 to 29 years Correlation Summary
| Measurement | Soviet Union | Northern European |
| Minimum | 0.50% | 4.3% |
| Maximum | 42.9% | 59.4% |
| Range | 42.4% | 55.1% |
| Mean | 7.7% | 18.6% |
| Median | 5.8% | 12.3% |
| Interquartile 25% (IQ1) | 4.4% | 6.7% |
| Interquartile 75% (IQ3) | 8.0% | 23.1% |
| Interquartile Range (IQR) | 3.6% | 16.4% |
| Standard Deviation (Sample) | 8.4% | 14.7% |
| Standard Deviation (Population) | 8.3% | 14.4% |
Similar Demographics by Unemployment Among Ages 25 to 29 years
Demographics Similar to Soviet Union by Unemployment Among Ages 25 to 29 years
In terms of unemployment among ages 25 to 29 years, the demographic groups most similar to Soviet Union are Burmese (6.2%, a difference of 0.030%), German Russian (6.2%, a difference of 0.060%), Immigrants from Turkey (6.2%, a difference of 0.080%), Immigrants from Australia (6.2%, a difference of 0.12%), and Latvian (6.2%, a difference of 0.14%).
| Demographics | Rating | Rank | Unemployment Among Ages 25 to 29 years |
| Czechs | 99.2 /100 | #43 | Exceptional 6.2% |
| Mongolians | 99.2 /100 | #44 | Exceptional 6.2% |
| Venezuelans | 99.1 /100 | #45 | Exceptional 6.2% |
| Immigrants | Lithuania | 99.0 /100 | #46 | Exceptional 6.2% |
| Latvians | 99.0 /100 | #47 | Exceptional 6.2% |
| Immigrants | Australia | 99.0 /100 | #48 | Exceptional 6.2% |
| German Russians | 99.0 /100 | #49 | Exceptional 6.2% |
| Soviet Union | 98.9 /100 | #50 | Exceptional 6.2% |
| Burmese | 98.9 /100 | #51 | Exceptional 6.2% |
| Immigrants | Turkey | 98.9 /100 | #52 | Exceptional 6.2% |
| Turks | 98.8 /100 | #53 | Exceptional 6.2% |
| Swedes | 98.8 /100 | #54 | Exceptional 6.2% |
| Immigrants | Netherlands | 98.7 /100 | #55 | Exceptional 6.2% |
| Immigrants | Burma/Myanmar | 98.7 /100 | #56 | Exceptional 6.2% |
| Immigrants | Saudi Arabia | 98.6 /100 | #57 | Exceptional 6.2% |
Demographics Similar to Northern Europeans by Unemployment Among Ages 25 to 29 years
In terms of unemployment among ages 25 to 29 years, the demographic groups most similar to Northern Europeans are Immigrants from Croatia (6.5%, a difference of 0.010%), Immigrants from Vietnam (6.5%, a difference of 0.020%), Immigrants from Europe (6.5%, a difference of 0.030%), Polish (6.5%, a difference of 0.11%), and Eastern European (6.5%, a difference of 0.11%).
| Demographics | Rating | Rank | Unemployment Among Ages 25 to 29 years |
| Sri Lankans | 80.3 /100 | #129 | Excellent 6.5% |
| Immigrants | Peru | 79.9 /100 | #130 | Good 6.5% |
| Immigrants | Afghanistan | 79.2 /100 | #131 | Good 6.5% |
| Poles | 76.6 /100 | #132 | Good 6.5% |
| Immigrants | Europe | 75.7 /100 | #133 | Good 6.5% |
| Immigrants | Vietnam | 75.6 /100 | #134 | Good 6.5% |
| Immigrants | Croatia | 75.5 /100 | #135 | Good 6.5% |
| Northern Europeans | 75.4 /100 | #136 | Good 6.5% |
| Eastern Europeans | 74.1 /100 | #137 | Good 6.5% |
| Immigrants | Belgium | 73.8 /100 | #138 | Good 6.5% |
| Austrians | 73.8 /100 | #139 | Good 6.5% |
| Immigrants | Pakistan | 73.8 /100 | #140 | Good 6.5% |
| Maltese | 72.9 /100 | #141 | Good 6.5% |
| Slavs | 72.5 /100 | #142 | Good 6.5% |
| Lithuanians | 72.2 /100 | #143 | Good 6.5% |