Soviet Union vs Japanese Unemployment Among Seniors over 75 years
COMPARE
Soviet Union
Japanese
Unemployment Among Seniors over 75 years
Unemployment Among Seniors over 75 years Comparison
Soviet Union
Japanese
6.6%
UNEMPLOYMENT AMONG SENIORS OVER 75 YEARS
100.0/ 100
METRIC RATING
9th/ 347
METRIC RANK
8.3%
UNEMPLOYMENT AMONG SENIORS OVER 75 YEARS
97.5/ 100
METRIC RATING
119th/ 347
METRIC RANK
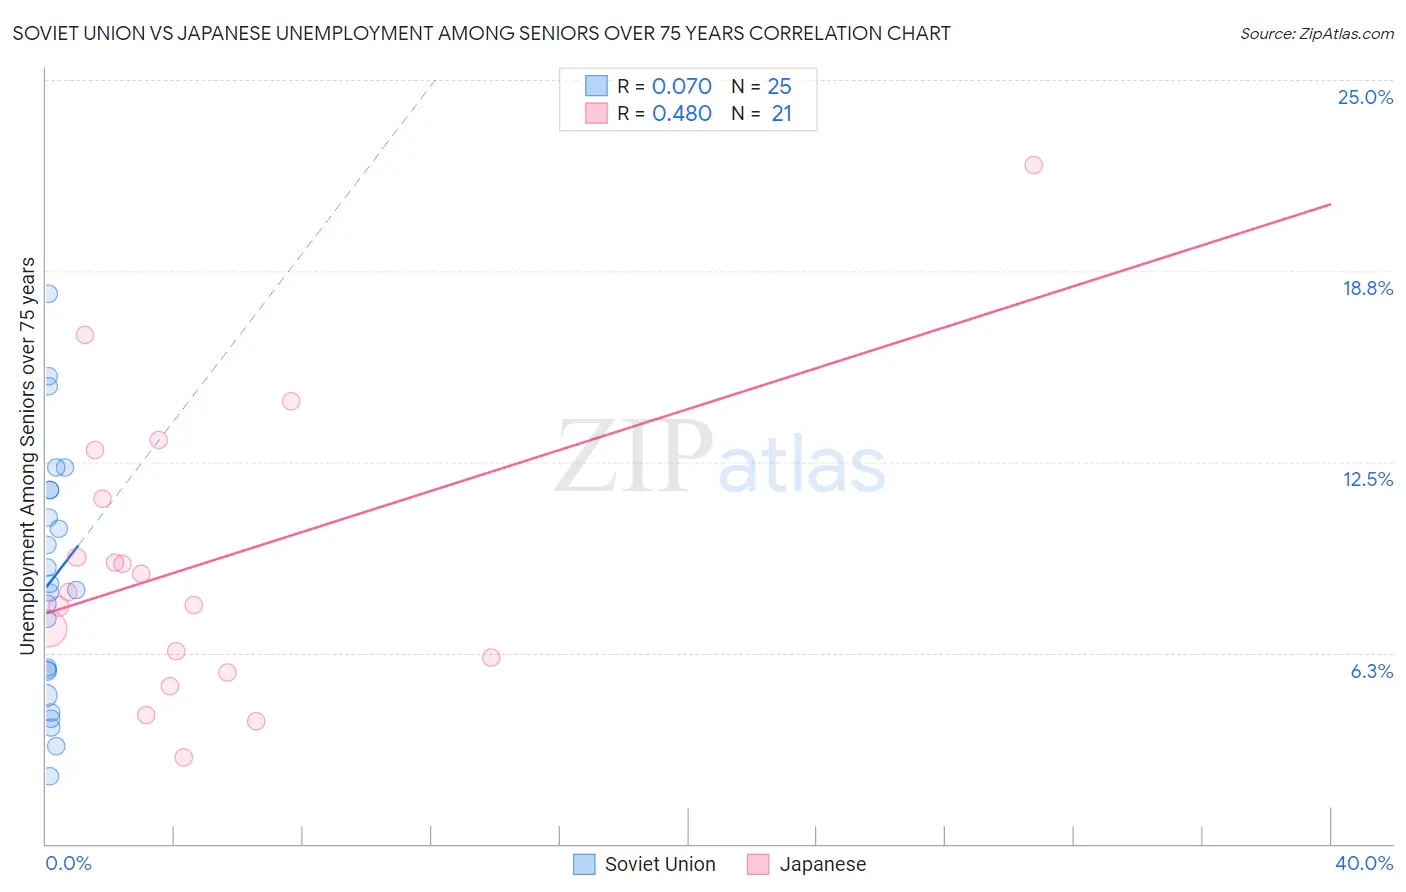
Soviet Union vs Japanese Unemployment Among Seniors over 75 years Correlation Chart
The statistical analysis conducted on geographies consisting of 39,610,083 people shows a slight positive correlation between the proportion of Soviet Union and unemployment rate among seniors over the age of 75 in the United States with a correlation coefficient (R) of 0.070 and weighted average of 6.6%. Similarly, the statistical analysis conducted on geographies consisting of 149,299,212 people shows a moderate positive correlation between the proportion of Japanese and unemployment rate among seniors over the age of 75 in the United States with a correlation coefficient (R) of 0.480 and weighted average of 8.3%, a difference of 25.1%.
Unemployment Among Seniors over 75 years Correlation Summary
| Measurement | Soviet Union | Japanese |
| Minimum | 2.2% | 2.8% |
| Maximum | 18.0% | 22.2% |
| Range | 15.8% | 19.4% |
| Mean | 8.6% | 9.2% |
| Median | 8.3% | 8.2% |
| Interquartile 25% (IQ1) | 5.2% | 5.8% |
| Interquartile 75% (IQ3) | 11.6% | 12.1% |
| Interquartile Range (IQR) | 6.3% | 6.2% |
| Standard Deviation (Sample) | 4.1% | 4.7% |
| Standard Deviation (Population) | 4.0% | 4.6% |
Similar Demographics by Unemployment Among Seniors over 75 years
Demographics Similar to Soviet Union by Unemployment Among Seniors over 75 years
In terms of unemployment among seniors over 75 years, the demographic groups most similar to Soviet Union are Yuman (6.7%, a difference of 0.22%), Immigrants from Grenada (6.7%, a difference of 0.31%), Comanche (6.7%, a difference of 0.45%), Immigrants from Congo (6.7%, a difference of 1.3%), and Taiwanese (6.6%, a difference of 1.3%).
| Demographics | Rating | Rank | Unemployment Among Seniors over 75 years |
| Chinese | 100.0 /100 | #2 | Exceptional 5.9% |
| Cheyenne | 100.0 /100 | #3 | Exceptional 5.9% |
| Alsatians | 100.0 /100 | #4 | Exceptional 6.1% |
| Hopi | 100.0 /100 | #5 | Exceptional 6.3% |
| Immigrants | Armenia | 100.0 /100 | #6 | Exceptional 6.5% |
| Spanish American Indians | 100.0 /100 | #7 | Exceptional 6.5% |
| Taiwanese | 100.0 /100 | #8 | Exceptional 6.6% |
| Soviet Union | 100.0 /100 | #9 | Exceptional 6.6% |
| Yuman | 100.0 /100 | #10 | Exceptional 6.7% |
| Immigrants | Grenada | 100.0 /100 | #11 | Exceptional 6.7% |
| Comanche | 100.0 /100 | #12 | Exceptional 6.7% |
| Immigrants | Congo | 100.0 /100 | #13 | Exceptional 6.7% |
| Ute | 100.0 /100 | #14 | Exceptional 6.8% |
| Icelanders | 100.0 /100 | #15 | Exceptional 7.0% |
| Seminole | 100.0 /100 | #16 | Exceptional 7.1% |
Demographics Similar to Japanese by Unemployment Among Seniors over 75 years
In terms of unemployment among seniors over 75 years, the demographic groups most similar to Japanese are Immigrants from Asia (8.3%, a difference of 0.020%), Immigrants from Croatia (8.3%, a difference of 0.15%), Immigrants from Russia (8.3%, a difference of 0.21%), Immigrants from Middle Africa (8.3%, a difference of 0.27%), and Immigrants from Nepal (8.3%, a difference of 0.29%).
| Demographics | Rating | Rank | Unemployment Among Seniors over 75 years |
| Immigrants | India | 98.6 /100 | #112 | Exceptional 8.2% |
| Asians | 98.5 /100 | #113 | Exceptional 8.3% |
| Trinidadians and Tobagonians | 98.4 /100 | #114 | Exceptional 8.3% |
| Sudanese | 98.2 /100 | #115 | Exceptional 8.3% |
| Immigrants | West Indies | 98.1 /100 | #116 | Exceptional 8.3% |
| Immigrants | Greece | 97.9 /100 | #117 | Exceptional 8.3% |
| Immigrants | Middle Africa | 97.9 /100 | #118 | Exceptional 8.3% |
| Japanese | 97.5 /100 | #119 | Exceptional 8.3% |
| Immigrants | Asia | 97.4 /100 | #120 | Exceptional 8.3% |
| Immigrants | Croatia | 97.2 /100 | #121 | Exceptional 8.3% |
| Immigrants | Russia | 97.1 /100 | #122 | Exceptional 8.3% |
| Immigrants | Nepal | 96.9 /100 | #123 | Exceptional 8.3% |
| Thais | 96.8 /100 | #124 | Exceptional 8.3% |
| Immigrants | Moldova | 96.7 /100 | #125 | Exceptional 8.3% |
| Belizeans | 96.3 /100 | #126 | Exceptional 8.4% |