Soviet Union vs Immigrants from Uruguay Unemployment Among Ages 20 to 24 years

COMPARE

Soviet Union
Race
Ancestry
AfghanAfricanAlaska NativeAlaskan AthabascanAlbanianAleutAlsatianAmericanApacheArabArapahoArgentineanArmenianAssyrian/Chaldean/SyriacAustralianAustrianBahamianBangladeshiBarbadianBasqueBelgianBelizeanBermudanBhutaneseBlackfeetBolivianBrazilianBritishBritish West IndianBulgarianBurmeseCajunCambodianCanadianCape VerdeanCarpatho RusynCelticCentral AmericanCentral American IndianCherokeeCheyenneChickasawChileanChineseChippewaChoctawColombianColvilleComancheCosta RicanCreeCreekCroatianCrowCubanCypriotCzechCzechoslovakianDanishDelawareDominicanDutchDutch West IndianEastern EuropeanEcuadorianEgyptianEnglishEstonianEthiopianEuropeanFijianFilipinoFinnishFrenchFrench American IndianFrench CanadianGermanGerman RussianGhanaianGreekGuamanian/ChamorroGuatemalanGuyaneseHaitianHmongHonduranHopiHoumaHungarianIcelanderIndian (Asian)IndonesianInupiatIranianIraqiIrishIroquoisIsraeliItalianJamaicanJapaneseJordanianKenyanKiowaKoreanLaotianLatvianLebaneseLiberianLithuanianLumbeeLuxembourgerMacedonianMalaysianMalteseMarshalleseMenomineeMexicanMexican American IndianMongolianMoroccanNative HawaiianNavajoNepaleseNew ZealanderNicaraguanNigerianNorthern EuropeanNorwegianOkinawanOsageOttawaPaiutePakistaniPalestinianPanamanianParaguayanPennsylvania GermanPeruvianPimaPolishPortuguesePotawatomiPuebloPuerto RicanPuget Sound SalishRomanianRussianSalvadoranSamoanScandinavianScotch-IrishScottishSeminoleSenegaleseSerbianShoshoneSierra LeoneanSiouxSlavicSlovakSloveneSomaliSouth AfricanSouth AmericanSouth American IndianSoviet UnionSpaniardSpanishSpanish AmericanSpanish American IndianSri LankanSubsaharan AfricanSudaneseSwedishSwissSyrianTaiwaneseThaiTlingit-HaidaTohono O'OdhamTonganTrinidadian and TobagonianTsimshianTurkishU.S. Virgin IslanderUgandanUkrainianUruguayanUteVenezuelanVietnameseWelshWest IndianYakamaYaquiYugoslavianYumanYup'ikZimbabwean
Immigration
NonimmigrantsImmigrantsAfghanistanAfricaAlbaniaArgentinaArmeniaAsiaAustraliaAustriaBahamasBangladeshBarbadosBelarusBelgiumBelizeBoliviaBosnia and HerzegovinaBrazilBulgariaBurma/MyanmarCabo VerdeCambodiaCameroonCanadaCaribbeanCentral AmericaChileChinaColombiaCongoCosta RicaCroatiaCubaCzechoslovakiaDenmarkDominicaDominican RepublicEastern AfricaEastern AsiaEastern EuropeEcuadorEgyptEl SalvadorEnglandEritreaEthiopiaEuropeFijiFranceGermanyGhanaGreeceGrenadaGuatemalaGuyanaHaitiHondurasHong KongHungaryIndiaIndonesiaIranIraqIrelandIsraelItalyJamaicaJapanJordanKazakhstanKenyaKoreaKuwaitLaosLatin AmericaLatviaLebanonLiberiaLithuaniaMalaysiaMexicoMicronesiaMiddle AfricaMoldovaMoroccoNepalNetherlandsNicaraguaNigeriaNorth AmericaNorth MacedoniaNorthern AfricaNorthern EuropeNorwayOceaniaPakistanPanamaPeruPhilippinesPolandPortugalRomaniaRussiaSaudi ArabiaScotlandSenegalSerbiaSierra LeoneSingaporeSomaliaSouth AfricaSouth AmericaSouth Central AsiaSouth Eastern AsiaSouthern EuropeSpainSri LankaSt. Vincent and the GrenadinesSudanSwedenSwitzerlandSyriaTaiwanThailandTrinidad and TobagoTurkeyUgandaUkraineUzbekistanVenezuelaVietnamWest IndiesWestern AfricaWestern AsiaWestern EuropeYemenZaireZimbabweAzores
Immigrants from Uruguay
Race
Ancestry
AfghanAfricanAlaska NativeAlaskan AthabascanAlbanianAleutAlsatianAmericanApacheArabArapahoArgentineanArmenianAssyrian/Chaldean/SyriacAustralianAustrianBahamianBangladeshiBarbadianBasqueBelgianBelizeanBermudanBhutaneseBlackfeetBolivianBrazilianBritishBritish West IndianBulgarianBurmeseCajunCambodianCanadianCape VerdeanCarpatho RusynCelticCentral AmericanCentral American IndianCherokeeCheyenneChickasawChileanChineseChippewaChoctawColombianColvilleComancheCosta RicanCreeCreekCroatianCrowCubanCypriotCzechCzechoslovakianDanishDelawareDominicanDutchDutch West IndianEastern EuropeanEcuadorianEgyptianEnglishEstonianEthiopianEuropeanFijianFilipinoFinnishFrenchFrench American IndianFrench CanadianGermanGerman RussianGhanaianGreekGuamanian/ChamorroGuatemalanGuyaneseHaitianHmongHonduranHopiHoumaHungarianIcelanderIndian (Asian)IndonesianInupiatIranianIraqiIrishIroquoisIsraeliItalianJamaicanJapaneseJordanianKenyanKiowaKoreanLaotianLatvianLebaneseLiberianLithuanianLumbeeLuxembourgerMacedonianMalaysianMalteseMarshalleseMenomineeMexicanMexican American IndianMongolianMoroccanNative HawaiianNavajoNepaleseNew ZealanderNicaraguanNigerianNorthern EuropeanNorwegianOkinawanOsageOttawaPaiutePakistaniPalestinianPanamanianParaguayanPennsylvania GermanPeruvianPimaPolishPortuguesePotawatomiPuebloPuerto RicanPuget Sound SalishRomanianRussianSalvadoranSamoanScandinavianScotch-IrishScottishSeminoleSenegaleseSerbianShoshoneSierra LeoneanSiouxSlavicSlovakSloveneSomaliSouth AfricanSouth AmericanSouth American IndianSpaniardSpanishSpanish AmericanSpanish American IndianSri LankanSubsaharan AfricanSudaneseSwedishSwissSyrianTaiwaneseThaiTlingit-HaidaTohono O'OdhamTonganTrinidadian and TobagonianTsimshianTurkishU.S. Virgin IslanderUgandanUkrainianUruguayanUteVenezuelanVietnameseWelshWest IndianYakamaYaquiYugoslavianYumanYup'ikZimbabwean
Immigration
NonimmigrantsImmigrantsAfghanistanAfricaAlbaniaArgentinaArmeniaAsiaAustraliaAustriaBahamasBangladeshBarbadosBelarusBelgiumBelizeBoliviaBosnia and HerzegovinaBrazilBulgariaBurma/MyanmarCabo VerdeCambodiaCameroonCanadaCaribbeanCentral AmericaChileChinaColombiaCongoCosta RicaCroatiaCubaCzechoslovakiaDenmarkDominicaDominican RepublicEastern AfricaEastern AsiaEastern EuropeEcuadorEgyptEl SalvadorEnglandEritreaEthiopiaEuropeFijiFranceGermanyGhanaGreeceGrenadaGuatemalaGuyanaHaitiHondurasHong KongHungaryIndiaIndonesiaIranIraqIrelandIsraelItalyJamaicaJapanJordanKazakhstanKenyaKoreaKuwaitLaosLatin AmericaLatviaLebanonLiberiaLithuaniaMalaysiaMexicoMicronesiaMiddle AfricaMoldovaMoroccoNepalNetherlandsNicaraguaNigeriaNorth AmericaNorth MacedoniaNorthern AfricaNorthern EuropeNorwayOceaniaPakistanPanamaPeruPhilippinesPolandPortugalRomaniaRussiaSaudi ArabiaScotlandSenegalSerbiaSierra LeoneSingaporeSomaliaSouth AfricaSouth AmericaSouth Central AsiaSouth Eastern AsiaSouthern EuropeSpainSri LankaSt. Vincent and the GrenadinesSudanSwedenSwitzerlandSyriaTaiwanThailandTrinidad and TobagoTurkeyUgandaUkraineUruguayUzbekistanVenezuelaVietnamWest IndiesWestern AfricaWestern AsiaWestern EuropeYemenZaireZimbabweAzores
Unemployment Among Ages 20 to 24 years
Income
Poverty
Unemployment
Labor Participation
Family Structure
Vehicle Availability
Education Level
Disability

Unemployment Among Ages 20 to 24 years Comparison

Soviet Union

Immigrants from Uruguay

Tragic
Excellent
11.7%
UNEMPLOYMENT AMONG AGES 20 TO 24 YEARS
0.0/ 100
METRIC RATING
285th/ 347
METRIC RANK
10.1%
UNEMPLOYMENT AMONG AGES 20 TO 24 YEARS
89.6/ 100
METRIC RATING
117th/ 347
METRIC RANK

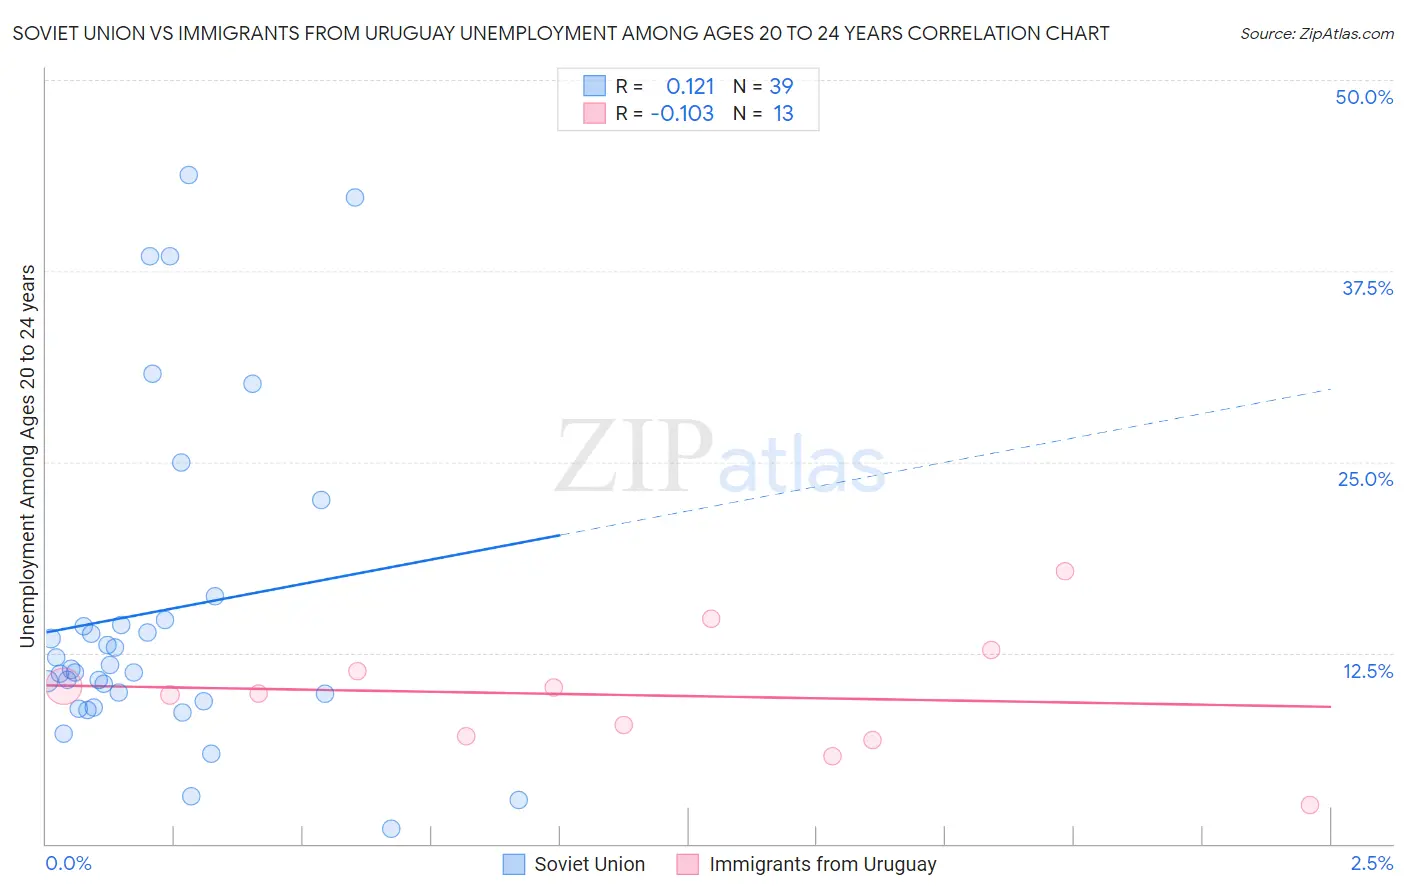
Soviet Union vs Immigrants from Uruguay Unemployment Among Ages 20 to 24 years Correlation Chart

The statistical analysis conducted on geographies consisting of 43,419,259 people shows a poor positive correlation between the proportion of Soviet Union and unemployment rate among population between the ages 20 and 24 in the United States with a correlation coefficient (R) of 0.121 and weighted average of 11.7%. Similarly, the statistical analysis conducted on geographies consisting of 131,967,308 people shows a poor negative correlation between the proportion of Immigrants from Uruguay and unemployment rate among population between the ages 20 and 24 in the United States with a correlation coefficient (R) of -0.103 and weighted average of 10.1%, a difference of 16.2%.
Soviet Union vs Immigrants from Uruguay Unemployment Among Ages 20 to 24 years

Unemployment Among Ages 20 to 24 years Correlation Summary

MeasurementSoviet UnionImmigrants from Uruguay
Minimum1.0%2.5%
Maximum43.8%17.8%
Range42.8%15.3%
Mean15.2%9.7%
Median11.4%9.8%
Interquartile 25% (IQ1)9.3%6.9%
Interquartile 75% (IQ3)14.7%12.0%
Interquartile Range (IQR)5.4%5.1%
Standard Deviation (Sample)10.7%4.0%
Standard Deviation (Population)10.6%3.8%

Similar Demographics by Unemployment Among Ages 20 to 24 years

Demographics Similar to Soviet Union by Unemployment Among Ages 20 to 24 years

In terms of unemployment among ages 20 to 24 years, the demographic groups most similar to Soviet Union are Immigrants from Western Africa (11.7%, a difference of 0.040%), Ghanaian (11.7%, a difference of 0.050%), Ecuadorian (11.8%, a difference of 0.12%), Immigrants from Ecuador (11.8%, a difference of 0.21%), and U.S. Virgin Islander (11.8%, a difference of 0.27%).
DemographicsRating | RankUnemployment Among Ages 20 to 24 years
Colville
0.0
/100
|
#278
Tragic
11.6%
Bahamians
0.0
/100
|
#279
Tragic
11.6%
Alaskan Athabascans
0.0
/100
|
#280
Tragic
11.6%
Armenians
0.0
/100
|
#281
Tragic
11.7%
Immigrants | Cameroon
0.0
/100
|
#282
Tragic
11.7%
Ghanaians
0.0
/100
|
#283
Tragic
11.7%
Immigrants | Western Africa
0.0
/100
|
#284
Tragic
11.7%
Soviet Union
0.0
/100
|
#285
Tragic
11.7%
Ecuadorians
0.0
/100
|
#286
Tragic
11.8%
Immigrants | Ecuador
0.0
/100
|
#287
Tragic
11.8%
U.S. Virgin Islanders
0.0
/100
|
#288
Tragic
11.8%
Belizeans
0.0
/100
|
#289
Tragic
11.8%
Immigrants | Caribbean
0.0
/100
|
#290
Tragic
11.8%
Central American Indians
0.0
/100
|
#291
Tragic
11.9%
Immigrants | Senegal
0.0
/100
|
#292
Tragic
11.9%

Demographics Similar to Immigrants from Uruguay by Unemployment Among Ages 20 to 24 years

In terms of unemployment among ages 20 to 24 years, the demographic groups most similar to Immigrants from Uruguay are Basque (10.1%, a difference of 0.010%), Immigrants from Morocco (10.1%, a difference of 0.090%), Paraguayan (10.1%, a difference of 0.10%), Ottawa (10.1%, a difference of 0.13%), and French (10.1%, a difference of 0.13%).
DemographicsRating | RankUnemployment Among Ages 20 to 24 years
Immigrants | Spain
93.1
/100
|
#110
Exceptional
10.1%
Immigrants | Indonesia
92.7
/100
|
#111
Exceptional
10.1%
Northern Europeans
92.7
/100
|
#112
Exceptional
10.1%
German Russians
92.4
/100
|
#113
Exceptional
10.1%
Ottawa
90.8
/100
|
#114
Exceptional
10.1%
Immigrants | Morocco
90.5
/100
|
#115
Exceptional
10.1%
Basques
89.8
/100
|
#116
Excellent
10.1%
Immigrants | Uruguay
89.6
/100
|
#117
Excellent
10.1%
Paraguayans
88.6
/100
|
#118
Excellent
10.1%
French
88.2
/100
|
#119
Excellent
10.1%
Immigrants | Canada
88.2
/100
|
#120
Excellent
10.1%
South Africans
87.8
/100
|
#121
Excellent
10.1%
Whites/Caucasians
87.4
/100
|
#122
Excellent
10.1%
Immigrants | Iraq
87.1
/100
|
#123
Excellent
10.1%
Immigrants | Japan
86.5
/100
|
#124
Excellent
10.1%