South American vs Immigrants from Southern Europe Unemployment Among Women with Children Under 18 years
COMPARE
South American
Immigrants from Southern Europe
Unemployment Among Women with Children Under 18 years
Unemployment Among Women with Children Under 18 years Comparison
South Americans
Immigrants from Southern Europe
5.7%
UNEMPLOYMENT AMONG WOMEN WITH CHILDREN UNDER 18 YEARS
10.0/ 100
METRIC RATING
212th/ 347
METRIC RANK
5.5%
UNEMPLOYMENT AMONG WOMEN WITH CHILDREN UNDER 18 YEARS
42.7/ 100
METRIC RATING
180th/ 347
METRIC RANK
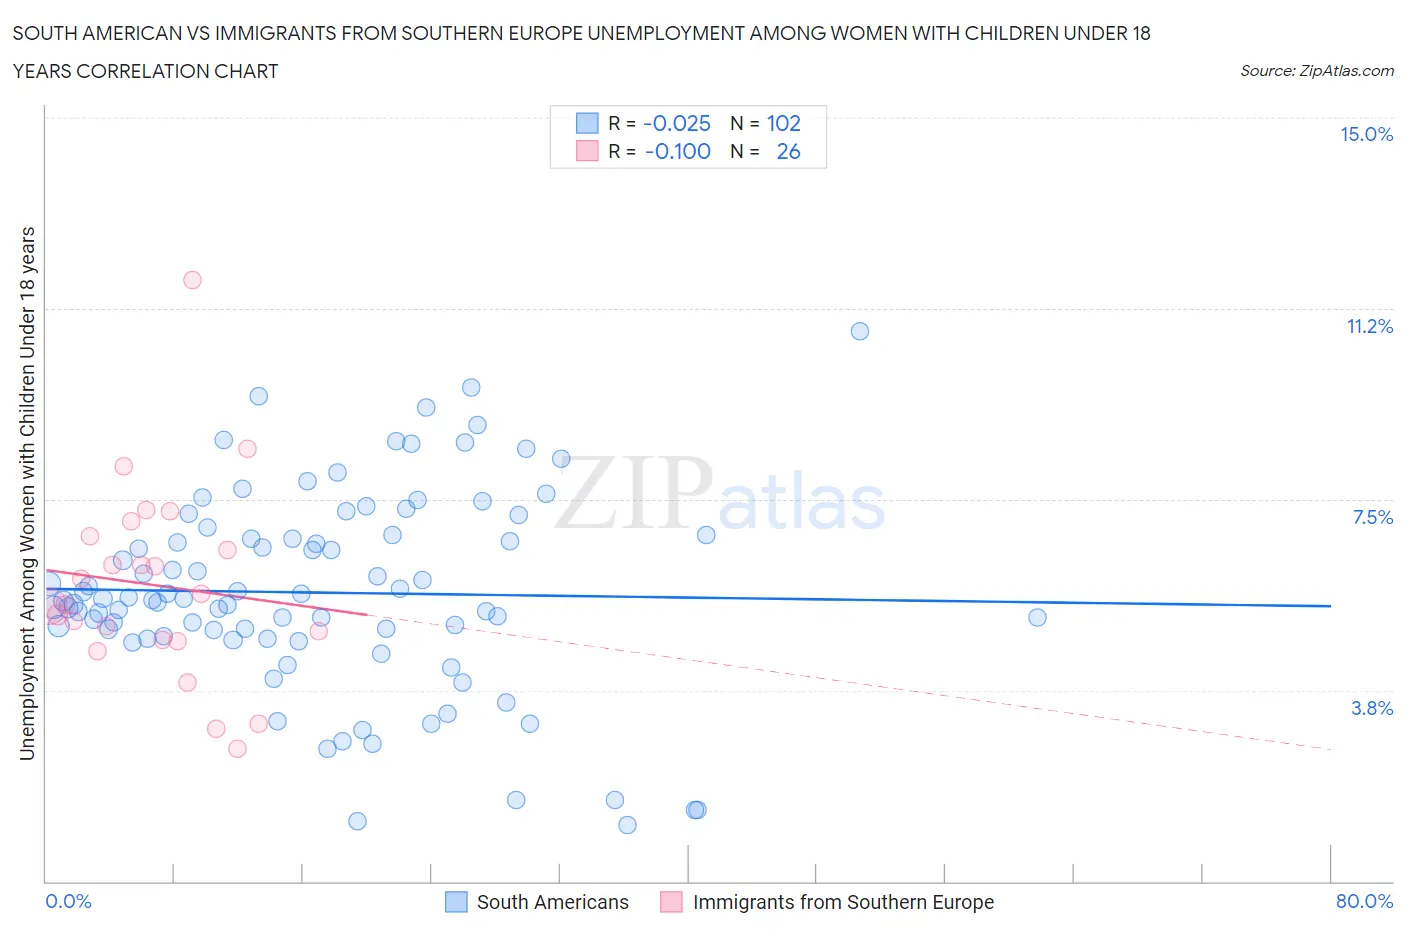
South American vs Immigrants from Southern Europe Unemployment Among Women with Children Under 18 years Correlation Chart
The statistical analysis conducted on geographies consisting of 466,888,990 people shows no correlation between the proportion of South Americans and unemployment rate among women with children under the age of 18 in the United States with a correlation coefficient (R) of -0.025 and weighted average of 5.7%. Similarly, the statistical analysis conducted on geographies consisting of 385,218,256 people shows a slight negative correlation between the proportion of Immigrants from Southern Europe and unemployment rate among women with children under the age of 18 in the United States with a correlation coefficient (R) of -0.100 and weighted average of 5.5%, a difference of 3.4%.
Unemployment Among Women with Children Under 18 years Correlation Summary
| Measurement | South American | Immigrants from Southern Europe |
| Minimum | 1.1% | 2.6% |
| Maximum | 10.8% | 11.8% |
| Range | 9.7% | 9.2% |
| Mean | 5.7% | 5.8% |
| Median | 5.5% | 5.5% |
| Interquartile 25% (IQ1) | 4.8% | 4.7% |
| Interquartile 75% (IQ3) | 6.8% | 6.8% |
| Interquartile Range (IQR) | 2.0% | 2.0% |
| Standard Deviation (Sample) | 1.9% | 1.9% |
| Standard Deviation (Population) | 1.9% | 1.9% |
Similar Demographics by Unemployment Among Women with Children Under 18 years
Demographics Similar to South Americans by Unemployment Among Women with Children Under 18 years
In terms of unemployment among women with children under 18 years, the demographic groups most similar to South Americans are Panamanian (5.7%, a difference of 0.010%), Nonimmigrants (5.7%, a difference of 0.12%), American (5.7%, a difference of 0.22%), Immigrants from Western Asia (5.6%, a difference of 0.23%), and Japanese (5.7%, a difference of 0.25%).
| Demographics | Rating | Rank | Unemployment Among Women with Children Under 18 years |
| Tsimshian | 15.2 /100 | #205 | Poor 5.6% |
| Nicaraguans | 12.3 /100 | #206 | Poor 5.6% |
| Peruvians | 12.1 /100 | #207 | Poor 5.6% |
| Immigrants | Costa Rica | 11.6 /100 | #208 | Poor 5.6% |
| Immigrants | Western Asia | 11.3 /100 | #209 | Poor 5.6% |
| Immigrants | Nonimmigrants | 10.6 /100 | #210 | Poor 5.7% |
| Panamanians | 10.1 /100 | #211 | Poor 5.7% |
| South Americans | 10.0 /100 | #212 | Poor 5.7% |
| Americans | 8.9 /100 | #213 | Tragic 5.7% |
| Japanese | 8.7 /100 | #214 | Tragic 5.7% |
| Immigrants | Uganda | 7.9 /100 | #215 | Tragic 5.7% |
| Immigrants | Peru | 7.4 /100 | #216 | Tragic 5.7% |
| Immigrants | Brazil | 7.1 /100 | #217 | Tragic 5.7% |
| Immigrants | Nicaragua | 7.0 /100 | #218 | Tragic 5.7% |
| Iroquois | 6.5 /100 | #219 | Tragic 5.7% |
Demographics Similar to Immigrants from Southern Europe by Unemployment Among Women with Children Under 18 years
In terms of unemployment among women with children under 18 years, the demographic groups most similar to Immigrants from Southern Europe are Syrian (5.5%, a difference of 0.010%), Immigrants from Hungary (5.5%, a difference of 0.10%), Immigrants from Sudan (5.5%, a difference of 0.15%), Costa Rican (5.5%, a difference of 0.18%), and Hawaiian (5.5%, a difference of 0.24%).
| Demographics | Rating | Rank | Unemployment Among Women with Children Under 18 years |
| Immigrants | Eastern Africa | 51.3 /100 | #173 | Average 5.4% |
| Immigrants | Uzbekistan | 50.0 /100 | #174 | Average 5.4% |
| Spanish | 49.0 /100 | #175 | Average 5.4% |
| Immigrants | Germany | 48.5 /100 | #176 | Average 5.5% |
| Hawaiians | 46.1 /100 | #177 | Average 5.5% |
| Costa Ricans | 45.2 /100 | #178 | Average 5.5% |
| Syrians | 42.8 /100 | #179 | Average 5.5% |
| Immigrants | Southern Europe | 42.7 /100 | #180 | Average 5.5% |
| Immigrants | Hungary | 41.3 /100 | #181 | Average 5.5% |
| Immigrants | Sudan | 40.6 /100 | #182 | Average 5.5% |
| Immigrants | Laos | 38.8 /100 | #183 | Fair 5.5% |
| Immigrants | Cambodia | 38.4 /100 | #184 | Fair 5.5% |
| Immigrants | Zaire | 38.1 /100 | #185 | Fair 5.5% |
| Indonesians | 36.3 /100 | #186 | Fair 5.5% |
| Malaysians | 35.7 /100 | #187 | Fair 5.5% |