South American vs Immigrants from Costa Rica Unemployment Among Seniors over 65 years
COMPARE
South American
Immigrants from Costa Rica
Unemployment Among Seniors over 65 years
Unemployment Among Seniors over 65 years Comparison
South Americans
Immigrants from Costa Rica
5.4%
UNEMPLOYMENT AMONG SENIORS OVER 65 YEARS
0.2/ 100
METRIC RATING
263rd/ 347
METRIC RANK
5.3%
UNEMPLOYMENT AMONG SENIORS OVER 65 YEARS
2.1/ 100
METRIC RATING
236th/ 347
METRIC RANK
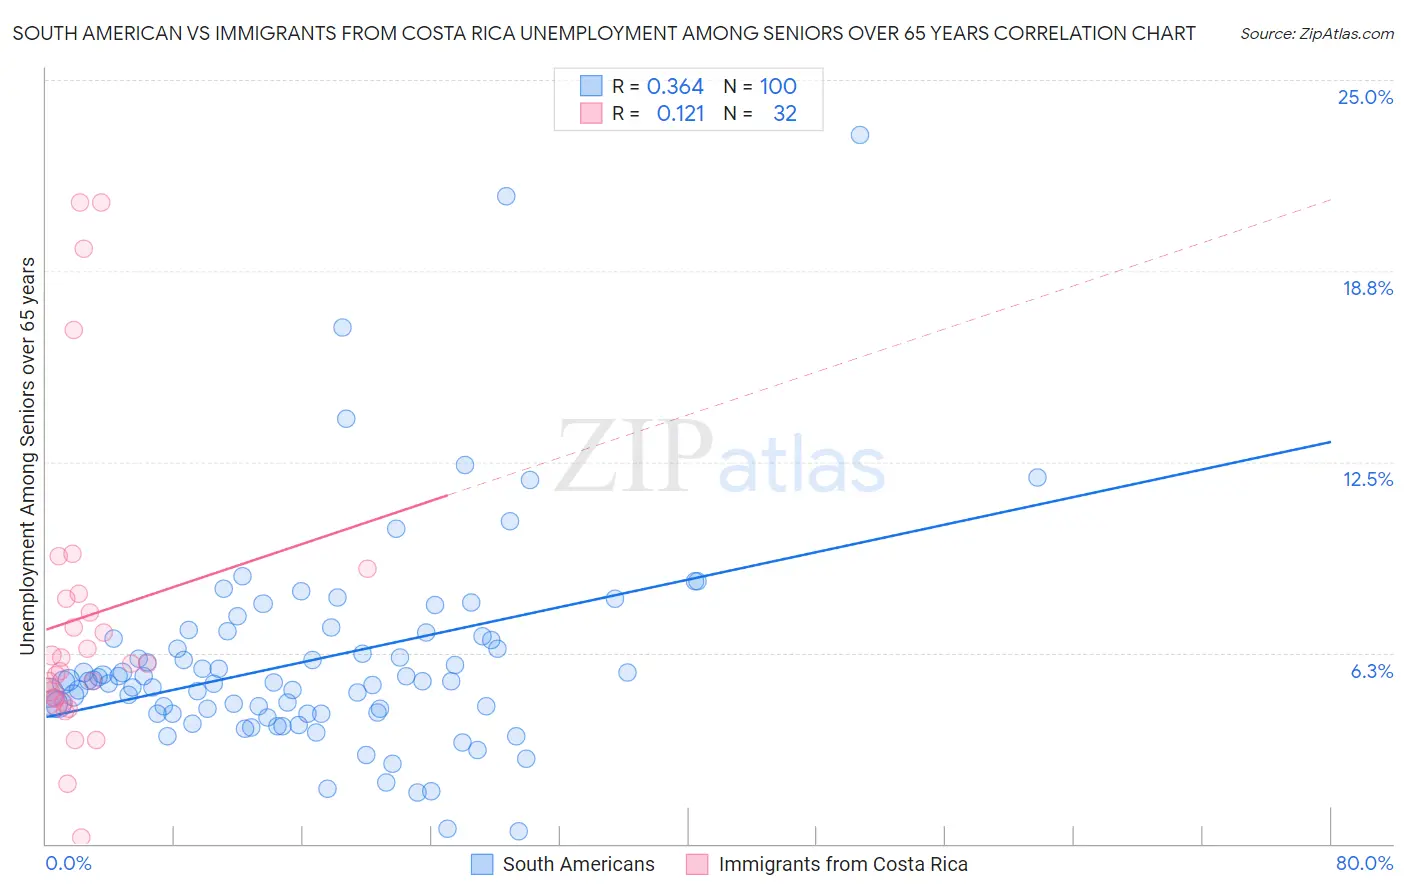
South American vs Immigrants from Costa Rica Unemployment Among Seniors over 65 years Correlation Chart
The statistical analysis conducted on geographies consisting of 429,029,959 people shows a mild positive correlation between the proportion of South Americans and unemployment rate amomg seniors over the age of 65 in the United States with a correlation coefficient (R) of 0.364 and weighted average of 5.4%. Similarly, the statistical analysis conducted on geographies consisting of 195,389,484 people shows a poor positive correlation between the proportion of Immigrants from Costa Rica and unemployment rate amomg seniors over the age of 65 in the United States with a correlation coefficient (R) of 0.121 and weighted average of 5.3%, a difference of 1.8%.
Unemployment Among Seniors over 65 years Correlation Summary
| Measurement | South American | Immigrants from Costa Rica |
| Minimum | 0.40% | 0.20% |
| Maximum | 23.2% | 21.0% |
| Range | 22.8% | 20.8% |
| Mean | 6.0% | 7.4% |
| Median | 5.3% | 5.9% |
| Interquartile 25% (IQ1) | 4.3% | 4.8% |
| Interquartile 75% (IQ3) | 6.8% | 8.1% |
| Interquartile Range (IQR) | 2.5% | 3.3% |
| Standard Deviation (Sample) | 3.5% | 5.1% |
| Standard Deviation (Population) | 3.5% | 5.0% |
Similar Demographics by Unemployment Among Seniors over 65 years
Demographics Similar to South Americans by Unemployment Among Seniors over 65 years
In terms of unemployment among seniors over 65 years, the demographic groups most similar to South Americans are Immigrants from Grenada (5.4%, a difference of 0.050%), Spanish American Indian (5.4%, a difference of 0.12%), Central American Indian (5.4%, a difference of 0.13%), Immigrants from Colombia (5.4%, a difference of 0.13%), and Pennsylvania German (5.4%, a difference of 0.15%).
| Demographics | Rating | Rank | Unemployment Among Seniors over 65 years |
| Moroccans | 0.5 /100 | #256 | Tragic 5.4% |
| Immigrants | Micronesia | 0.4 /100 | #257 | Tragic 5.4% |
| Sierra Leoneans | 0.4 /100 | #258 | Tragic 5.4% |
| Immigrants | Ghana | 0.4 /100 | #259 | Tragic 5.4% |
| Native Hawaiians | 0.3 /100 | #260 | Tragic 5.4% |
| Spanish American Indians | 0.2 /100 | #261 | Tragic 5.4% |
| Immigrants | Grenada | 0.2 /100 | #262 | Tragic 5.4% |
| South Americans | 0.2 /100 | #263 | Tragic 5.4% |
| Central American Indians | 0.2 /100 | #264 | Tragic 5.4% |
| Immigrants | Colombia | 0.2 /100 | #265 | Tragic 5.4% |
| Pennsylvania Germans | 0.2 /100 | #266 | Tragic 5.4% |
| Chippewa | 0.2 /100 | #267 | Tragic 5.4% |
| Hawaiians | 0.1 /100 | #268 | Tragic 5.4% |
| Immigrants | Southern Europe | 0.1 /100 | #269 | Tragic 5.4% |
| Immigrants | Morocco | 0.1 /100 | #270 | Tragic 5.4% |
Demographics Similar to Immigrants from Costa Rica by Unemployment Among Seniors over 65 years
In terms of unemployment among seniors over 65 years, the demographic groups most similar to Immigrants from Costa Rica are Immigrants from Greece (5.3%, a difference of 0.060%), Immigrants from Israel (5.3%, a difference of 0.070%), Immigrants from Senegal (5.3%, a difference of 0.13%), Immigrants from Albania (5.3%, a difference of 0.19%), and Immigrants from Trinidad and Tobago (5.3%, a difference of 0.24%).
| Demographics | Rating | Rank | Unemployment Among Seniors over 65 years |
| Samoans | 4.2 /100 | #229 | Tragic 5.3% |
| Immigrants | Argentina | 4.0 /100 | #230 | Tragic 5.3% |
| Hungarians | 3.9 /100 | #231 | Tragic 5.3% |
| Hopi | 3.5 /100 | #232 | Tragic 5.3% |
| Marshallese | 3.1 /100 | #233 | Tragic 5.3% |
| Blackfeet | 3.1 /100 | #234 | Tragic 5.3% |
| Immigrants | Albania | 2.7 /100 | #235 | Tragic 5.3% |
| Immigrants | Costa Rica | 2.1 /100 | #236 | Tragic 5.3% |
| Immigrants | Greece | 2.0 /100 | #237 | Tragic 5.3% |
| Immigrants | Israel | 2.0 /100 | #238 | Tragic 5.3% |
| Immigrants | Senegal | 1.8 /100 | #239 | Tragic 5.3% |
| Immigrants | Trinidad and Tobago | 1.6 /100 | #240 | Tragic 5.3% |
| Apache | 1.3 /100 | #241 | Tragic 5.3% |
| Bahamians | 0.9 /100 | #242 | Tragic 5.3% |
| Nigerians | 0.9 /100 | #243 | Tragic 5.3% |