South American Indian vs Ute Male Unemployment
COMPARE
South American Indian
Ute
Male Unemployment
Male Unemployment Comparison
South American Indians
Ute
5.5%
MALE UNEMPLOYMENT
7.6/ 100
METRIC RATING
210th/ 347
METRIC RANK
6.6%
MALE UNEMPLOYMENT
0.0/ 100
METRIC RATING
302nd/ 347
METRIC RANK
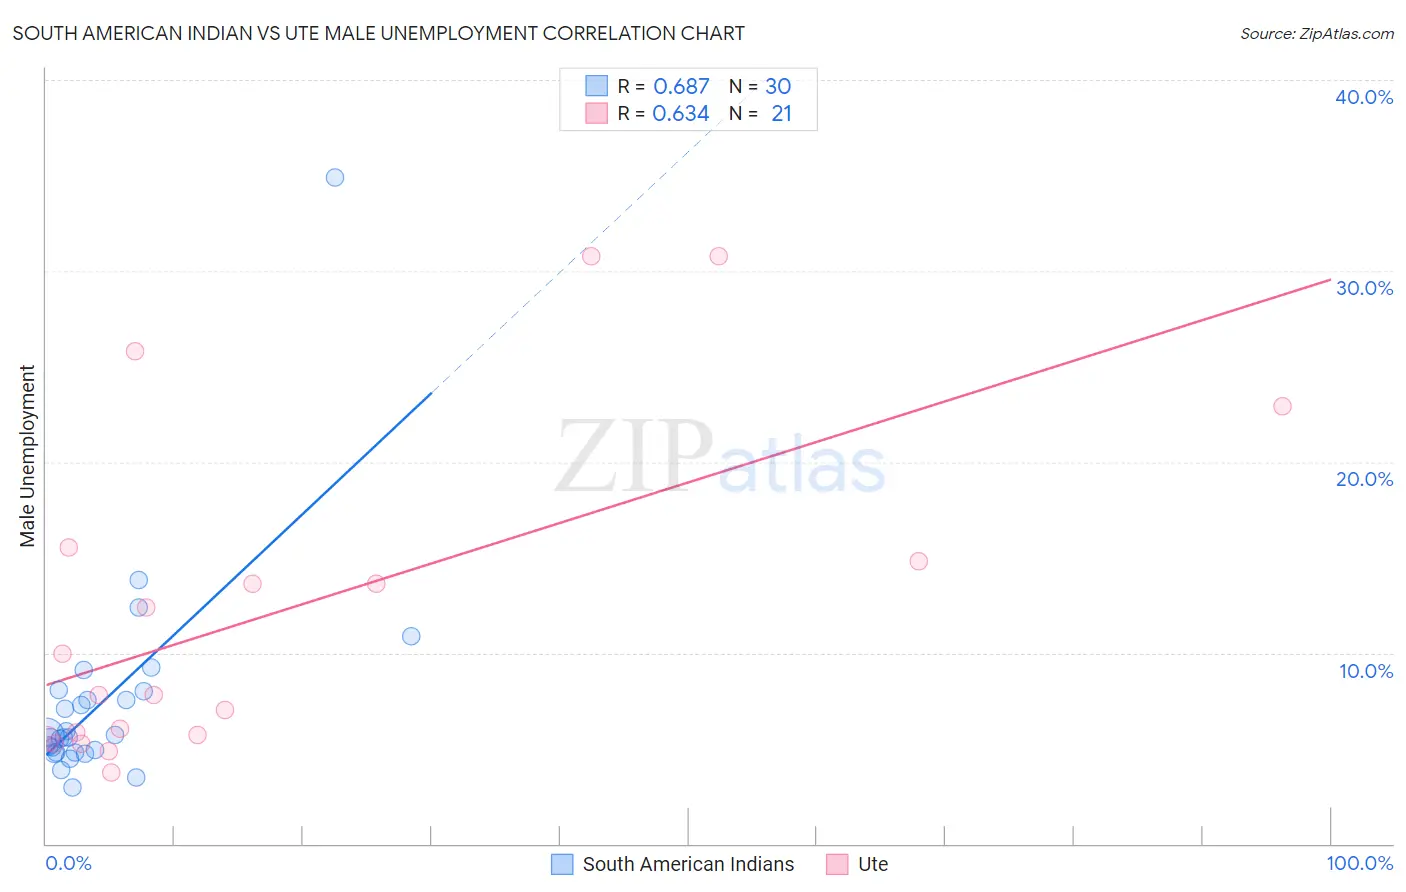
South American Indian vs Ute Male Unemployment Correlation Chart
The statistical analysis conducted on geographies consisting of 164,403,972 people shows a significant positive correlation between the proportion of South American Indians and unemployment rate among males in the United States with a correlation coefficient (R) of 0.687 and weighted average of 5.5%. Similarly, the statistical analysis conducted on geographies consisting of 55,563,809 people shows a significant positive correlation between the proportion of Ute and unemployment rate among males in the United States with a correlation coefficient (R) of 0.634 and weighted average of 6.6%, a difference of 20.9%.
Male Unemployment Correlation Summary
| Measurement | South American Indian | Ute |
| Minimum | 2.9% | 3.7% |
| Maximum | 34.9% | 30.8% |
| Range | 32.0% | 27.1% |
| Mean | 7.5% | 12.1% |
| Median | 5.6% | 7.8% |
| Interquartile 25% (IQ1) | 4.8% | 5.6% |
| Interquartile 75% (IQ3) | 8.0% | 15.2% |
| Interquartile Range (IQR) | 3.2% | 9.6% |
| Standard Deviation (Sample) | 5.8% | 8.6% |
| Standard Deviation (Population) | 5.7% | 8.4% |
Similar Demographics by Male Unemployment
Demographics Similar to South American Indians by Male Unemployment
In terms of male unemployment, the demographic groups most similar to South American Indians are Israeli (5.5%, a difference of 0.040%), Immigrants from Middle Africa (5.5%, a difference of 0.13%), Hmong (5.5%, a difference of 0.14%), Immigrants from Lebanon (5.5%, a difference of 0.18%), and Ugandan (5.5%, a difference of 0.30%).
| Demographics | Rating | Rank | Male Unemployment |
| Immigrants | Laos | 13.0 /100 | #203 | Poor 5.4% |
| Guamanians/Chamorros | 12.3 /100 | #204 | Poor 5.4% |
| Immigrants | Costa Rica | 11.4 /100 | #205 | Poor 5.5% |
| Immigrants | Ukraine | 9.9 /100 | #206 | Tragic 5.5% |
| Immigrants | Syria | 9.3 /100 | #207 | Tragic 5.5% |
| Immigrants | Lebanon | 8.6 /100 | #208 | Tragic 5.5% |
| Immigrants | Middle Africa | 8.3 /100 | #209 | Tragic 5.5% |
| South American Indians | 7.6 /100 | #210 | Tragic 5.5% |
| Israelis | 7.4 /100 | #211 | Tragic 5.5% |
| Hmong | 7.0 /100 | #212 | Tragic 5.5% |
| Ugandans | 6.3 /100 | #213 | Tragic 5.5% |
| Puget Sound Salish | 5.6 /100 | #214 | Tragic 5.5% |
| Samoans | 4.9 /100 | #215 | Tragic 5.5% |
| Immigrants | Immigrants | 4.3 /100 | #216 | Tragic 5.5% |
| Delaware | 4.2 /100 | #217 | Tragic 5.5% |
Demographics Similar to Ute by Male Unemployment
In terms of male unemployment, the demographic groups most similar to Ute are Immigrants from West Indies (6.7%, a difference of 0.36%), West Indian (6.7%, a difference of 0.37%), Trinidadian and Tobagonian (6.7%, a difference of 0.69%), Immigrants from Belize (6.6%, a difference of 0.71%), and Vietnamese (6.6%, a difference of 0.82%).
| Demographics | Rating | Rank | Male Unemployment |
| Belizeans | 0.0 /100 | #295 | Tragic 6.5% |
| Immigrants | Haiti | 0.0 /100 | #296 | Tragic 6.5% |
| Chippewa | 0.0 /100 | #297 | Tragic 6.6% |
| Jamaicans | 0.0 /100 | #298 | Tragic 6.6% |
| Immigrants | Bangladesh | 0.0 /100 | #299 | Tragic 6.6% |
| Vietnamese | 0.0 /100 | #300 | Tragic 6.6% |
| Immigrants | Belize | 0.0 /100 | #301 | Tragic 6.6% |
| Ute | 0.0 /100 | #302 | Tragic 6.6% |
| Immigrants | West Indies | 0.0 /100 | #303 | Tragic 6.7% |
| West Indians | 0.0 /100 | #304 | Tragic 6.7% |
| Trinidadians and Tobagonians | 0.0 /100 | #305 | Tragic 6.7% |
| Immigrants | Trinidad and Tobago | 0.0 /100 | #306 | Tragic 6.7% |
| Immigrants | Jamaica | 0.0 /100 | #307 | Tragic 6.7% |
| Aleuts | 0.0 /100 | #308 | Tragic 6.8% |
| Barbadians | 0.0 /100 | #309 | Tragic 6.9% |