South African vs Iranian Unemployment
COMPARE
South African
Iranian
Unemployment
Unemployment Comparison
South Africans
Iranians
5.1%
UNEMPLOYMENT
92.6/ 100
METRIC RATING
112th/ 347
METRIC RANK
5.1%
UNEMPLOYMENT
86.9/ 100
METRIC RATING
130th/ 347
METRIC RANK
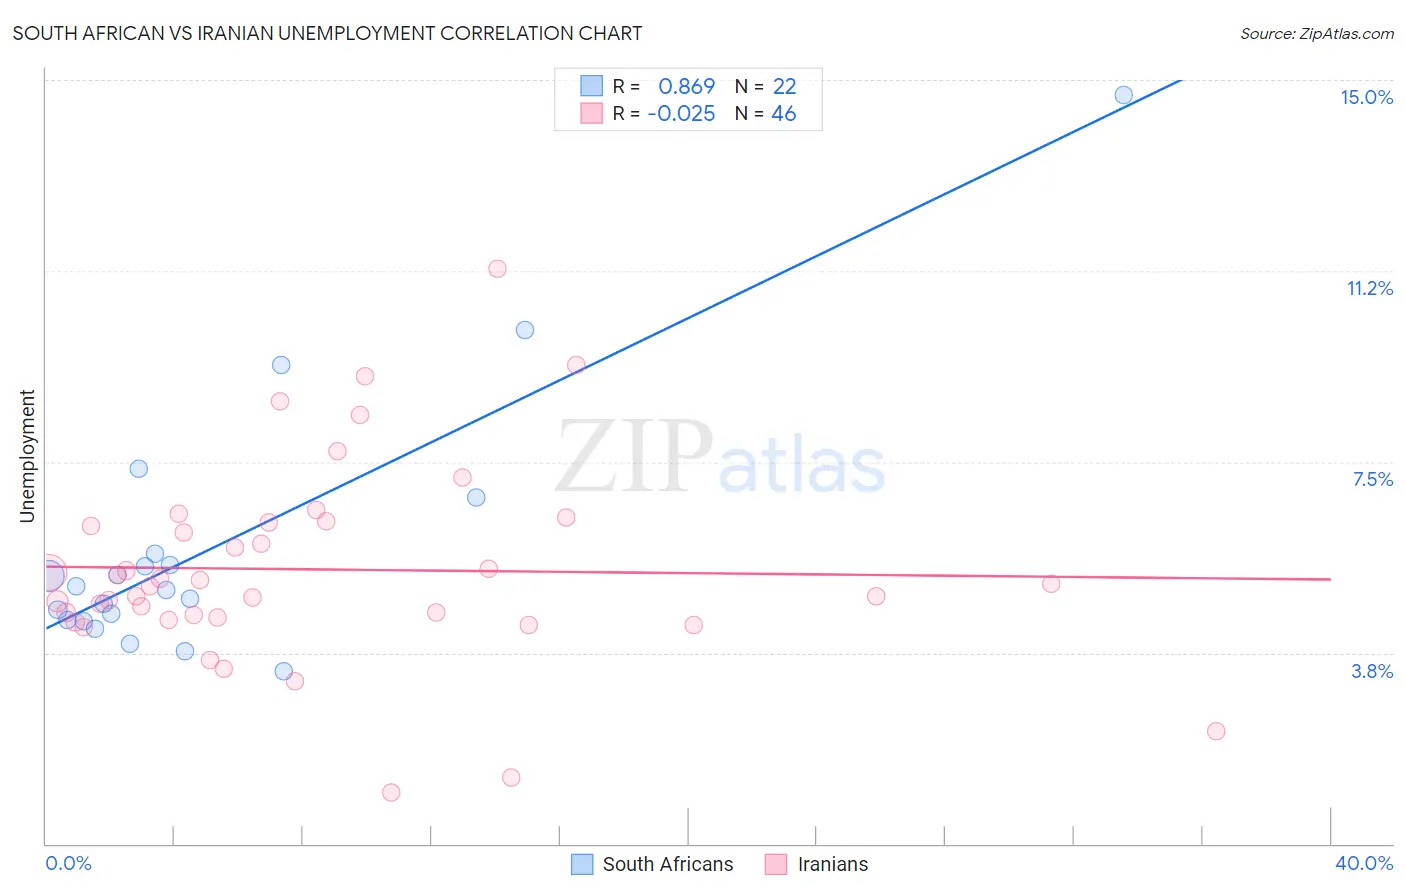
South African vs Iranian Unemployment Correlation Chart
The statistical analysis conducted on geographies consisting of 182,514,846 people shows a very strong positive correlation between the proportion of South Africans and unemployment in the United States with a correlation coefficient (R) of 0.869 and weighted average of 5.1%. Similarly, the statistical analysis conducted on geographies consisting of 316,755,420 people shows no correlation between the proportion of Iranians and unemployment in the United States with a correlation coefficient (R) of -0.025 and weighted average of 5.1%, a difference of 1.0%.
Unemployment Correlation Summary
| Measurement | South African | Iranian |
| Minimum | 3.4% | 1.0% |
| Maximum | 14.7% | 11.3% |
| Range | 11.3% | 10.3% |
| Mean | 5.8% | 5.4% |
| Median | 5.0% | 5.1% |
| Interquartile 25% (IQ1) | 4.4% | 4.4% |
| Interquartile 75% (IQ3) | 5.7% | 6.3% |
| Interquartile Range (IQR) | 1.3% | 1.9% |
| Standard Deviation (Sample) | 2.6% | 1.9% |
| Standard Deviation (Population) | 2.5% | 1.9% |
Demographics Similar to South Africans and Iranians by Unemployment
In terms of unemployment, the demographic groups most similar to South Africans are Argentinean (5.1%, a difference of 0.040%), Immigrants from Ireland (5.1%, a difference of 0.10%), Chilean (5.0%, a difference of 0.16%), Immigrants from Western Europe (5.1%, a difference of 0.31%), and Immigrants from Sri Lanka (5.1%, a difference of 0.32%). Similarly, the demographic groups most similar to Iranians are Immigrants from Croatia (5.1%, a difference of 0.030%), Immigrants from Eastern Africa (5.1%, a difference of 0.16%), Immigrants from Latvia (5.1%, a difference of 0.16%), Kenyan (5.1%, a difference of 0.18%), and Immigrants from Kenya (5.1%, a difference of 0.18%).
| Demographics | Rating | Rank | Unemployment |
| Chileans | 93.2 /100 | #111 | Exceptional 5.0% |
| South Africans | 92.6 /100 | #112 | Exceptional 5.1% |
| Argentineans | 92.4 /100 | #113 | Exceptional 5.1% |
| Immigrants | Ireland | 92.1 /100 | #114 | Exceptional 5.1% |
| Immigrants | Western Europe | 91.1 /100 | #115 | Exceptional 5.1% |
| Immigrants | Sri Lanka | 91.1 /100 | #116 | Exceptional 5.1% |
| Immigrants | Malaysia | 91.0 /100 | #117 | Exceptional 5.1% |
| Immigrants | Germany | 90.8 /100 | #118 | Exceptional 5.1% |
| Immigrants | France | 89.7 /100 | #119 | Excellent 5.1% |
| Macedonians | 89.7 /100 | #120 | Excellent 5.1% |
| Lebanese | 89.2 /100 | #121 | Excellent 5.1% |
| Immigrants | Switzerland | 89.1 /100 | #122 | Excellent 5.1% |
| Asians | 89.0 /100 | #123 | Excellent 5.1% |
| Ethiopians | 88.6 /100 | #124 | Excellent 5.1% |
| Immigrants | Eastern Asia | 88.3 /100 | #125 | Excellent 5.1% |
| Kenyans | 88.2 /100 | #126 | Excellent 5.1% |
| Immigrants | Kenya | 88.2 /100 | #127 | Excellent 5.1% |
| Immigrants | Eastern Africa | 88.1 /100 | #128 | Excellent 5.1% |
| Immigrants | Latvia | 88.0 /100 | #129 | Excellent 5.1% |
| Iranians | 86.9 /100 | #130 | Excellent 5.1% |
| Immigrants | Croatia | 86.8 /100 | #131 | Excellent 5.1% |