Somali vs Bahamian Unemployment Among Youth under 25 years
COMPARE
Somali
Bahamian
Unemployment Among Youth under 25 years
Unemployment Among Youth under 25 years Comparison
Somalis
Bahamians
10.7%
UNEMPLOYMENT AMONG YOUTH UNDER 25 YEARS
100.0/ 100
METRIC RATING
28th/ 347
METRIC RANK
13.1%
UNEMPLOYMENT AMONG YOUTH UNDER 25 YEARS
0.0/ 100
METRIC RATING
277th/ 347
METRIC RANK
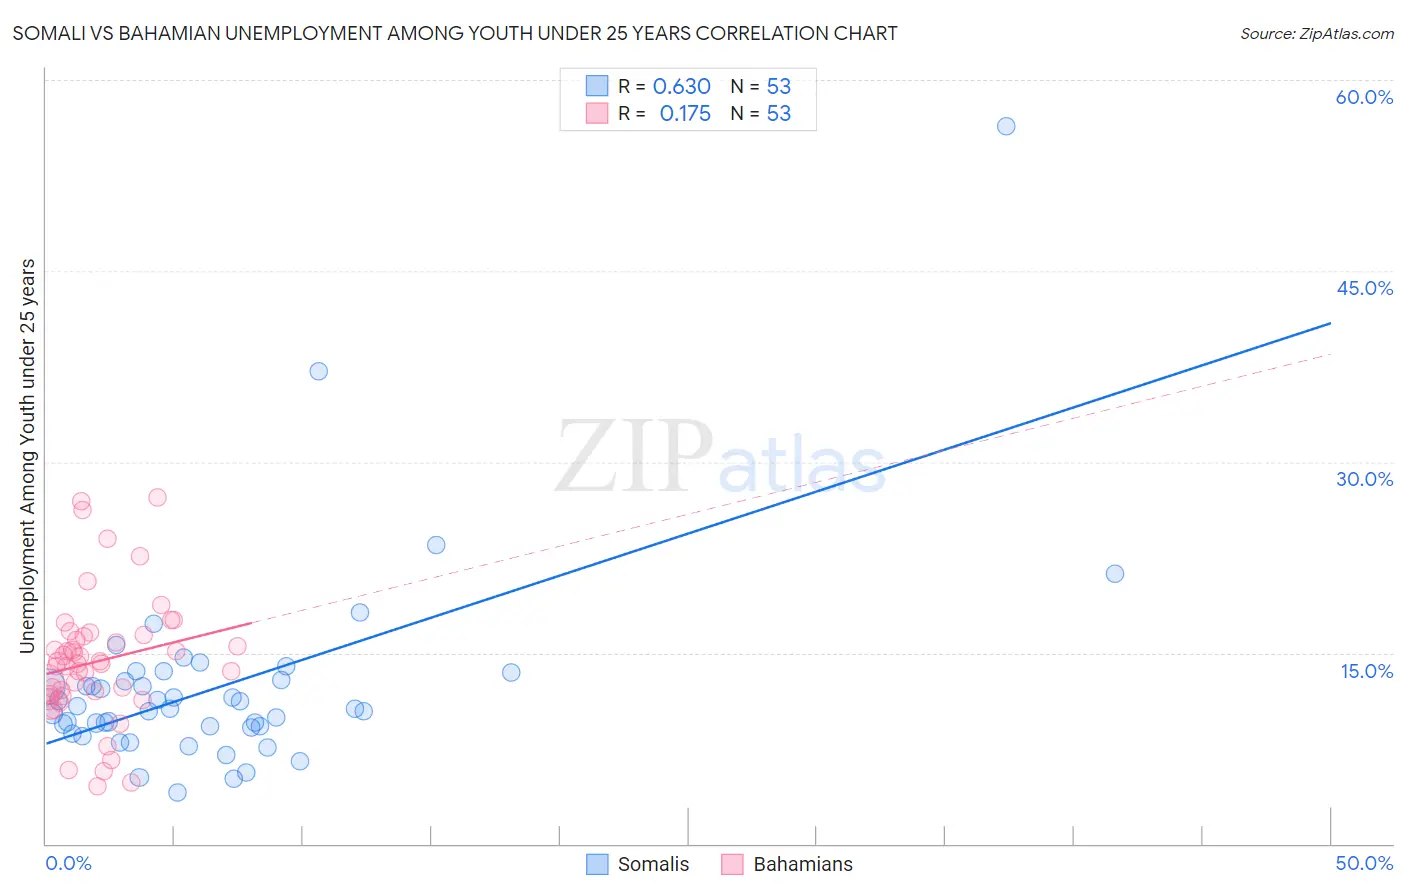
Somali vs Bahamian Unemployment Among Youth under 25 years Correlation Chart
The statistical analysis conducted on geographies consisting of 99,064,920 people shows a significant positive correlation between the proportion of Somalis and unemployment rate among youth under the age of 25 in the United States with a correlation coefficient (R) of 0.630 and weighted average of 10.7%. Similarly, the statistical analysis conducted on geographies consisting of 112,437,072 people shows a poor positive correlation between the proportion of Bahamians and unemployment rate among youth under the age of 25 in the United States with a correlation coefficient (R) of 0.175 and weighted average of 13.1%, a difference of 23.0%.
Unemployment Among Youth under 25 years Correlation Summary
| Measurement | Somali | Bahamian |
| Minimum | 4.0% | 4.5% |
| Maximum | 56.4% | 27.2% |
| Range | 52.4% | 22.7% |
| Mean | 12.4% | 14.3% |
| Median | 10.6% | 14.1% |
| Interquartile 25% (IQ1) | 9.1% | 11.6% |
| Interquartile 75% (IQ3) | 13.2% | 16.3% |
| Interquartile Range (IQR) | 4.1% | 4.7% |
| Standard Deviation (Sample) | 8.0% | 5.0% |
| Standard Deviation (Population) | 7.9% | 5.0% |
Similar Demographics by Unemployment Among Youth under 25 years
Demographics Similar to Somalis by Unemployment Among Youth under 25 years
In terms of unemployment among youth under 25 years, the demographic groups most similar to Somalis are Yugoslavian (10.7%, a difference of 0.040%), Immigrants from India (10.7%, a difference of 0.060%), Finnish (10.7%, a difference of 0.15%), Immigrants from North Macedonia (10.7%, a difference of 0.15%), and Chinese (10.7%, a difference of 0.34%).
| Demographics | Rating | Rank | Unemployment Among Youth under 25 years |
| Pennsylvania Germans | 100.0 /100 | #21 | Exceptional 10.6% |
| Belgians | 100.0 /100 | #22 | Exceptional 10.6% |
| Immigrants | Bosnia and Herzegovina | 100.0 /100 | #23 | Exceptional 10.6% |
| Finns | 100.0 /100 | #24 | Exceptional 10.7% |
| Immigrants | North Macedonia | 100.0 /100 | #25 | Exceptional 10.7% |
| Immigrants | India | 100.0 /100 | #26 | Exceptional 10.7% |
| Yugoslavians | 100.0 /100 | #27 | Exceptional 10.7% |
| Somalis | 100.0 /100 | #28 | Exceptional 10.7% |
| Chinese | 99.9 /100 | #29 | Exceptional 10.7% |
| Osage | 99.9 /100 | #30 | Exceptional 10.7% |
| Slovenes | 99.9 /100 | #31 | Exceptional 10.7% |
| Taiwanese | 99.9 /100 | #32 | Exceptional 10.8% |
| Europeans | 99.9 /100 | #33 | Exceptional 10.8% |
| English | 99.9 /100 | #34 | Exceptional 10.8% |
| Immigrants | Nepal | 99.9 /100 | #35 | Exceptional 10.8% |
Demographics Similar to Bahamians by Unemployment Among Youth under 25 years
In terms of unemployment among youth under 25 years, the demographic groups most similar to Bahamians are Immigrants from Uzbekistan (13.1%, a difference of 0.17%), African (13.2%, a difference of 0.26%), Bermudan (13.0%, a difference of 0.60%), Immigrants from Nigeria (13.0%, a difference of 0.71%), and Cajun (13.2%, a difference of 0.92%).
| Demographics | Rating | Rank | Unemployment Among Youth under 25 years |
| Immigrants | Liberia | 0.0 /100 | #270 | Tragic 12.8% |
| Immigrants | Bahamas | 0.0 /100 | #271 | Tragic 12.9% |
| Cape Verdeans | 0.0 /100 | #272 | Tragic 12.9% |
| Nigerians | 0.0 /100 | #273 | Tragic 13.0% |
| Immigrants | Nigeria | 0.0 /100 | #274 | Tragic 13.0% |
| Bermudans | 0.0 /100 | #275 | Tragic 13.0% |
| Immigrants | Uzbekistan | 0.0 /100 | #276 | Tragic 13.1% |
| Bahamians | 0.0 /100 | #277 | Tragic 13.1% |
| Africans | 0.0 /100 | #278 | Tragic 13.2% |
| Cajuns | 0.0 /100 | #279 | Tragic 13.2% |
| Ute | 0.0 /100 | #280 | Tragic 13.3% |
| Armenians | 0.0 /100 | #281 | Tragic 13.3% |
| Sierra Leoneans | 0.0 /100 | #282 | Tragic 13.3% |
| Immigrants | Cameroon | 0.0 /100 | #283 | Tragic 13.3% |
| Lumbee | 0.0 /100 | #284 | Tragic 13.3% |