Slovene vs Pueblo Unemployment Among Women with Children Ages 6 to 17 years
COMPARE
Slovene
Pueblo
Unemployment Among Women with Children Ages 6 to 17 years
Unemployment Among Women with Children Ages 6 to 17 years Comparison
Slovenes
Pueblo
9.1%
UNEMPLOYMENT AMONG WOMEN WITH CHILDREN AGES 6 TO 17 YEARS
28.5/ 100
METRIC RATING
190th/ 347
METRIC RANK
8.6%
UNEMPLOYMENT AMONG WOMEN WITH CHILDREN AGES 6 TO 17 YEARS
96.2/ 100
METRIC RATING
118th/ 347
METRIC RANK
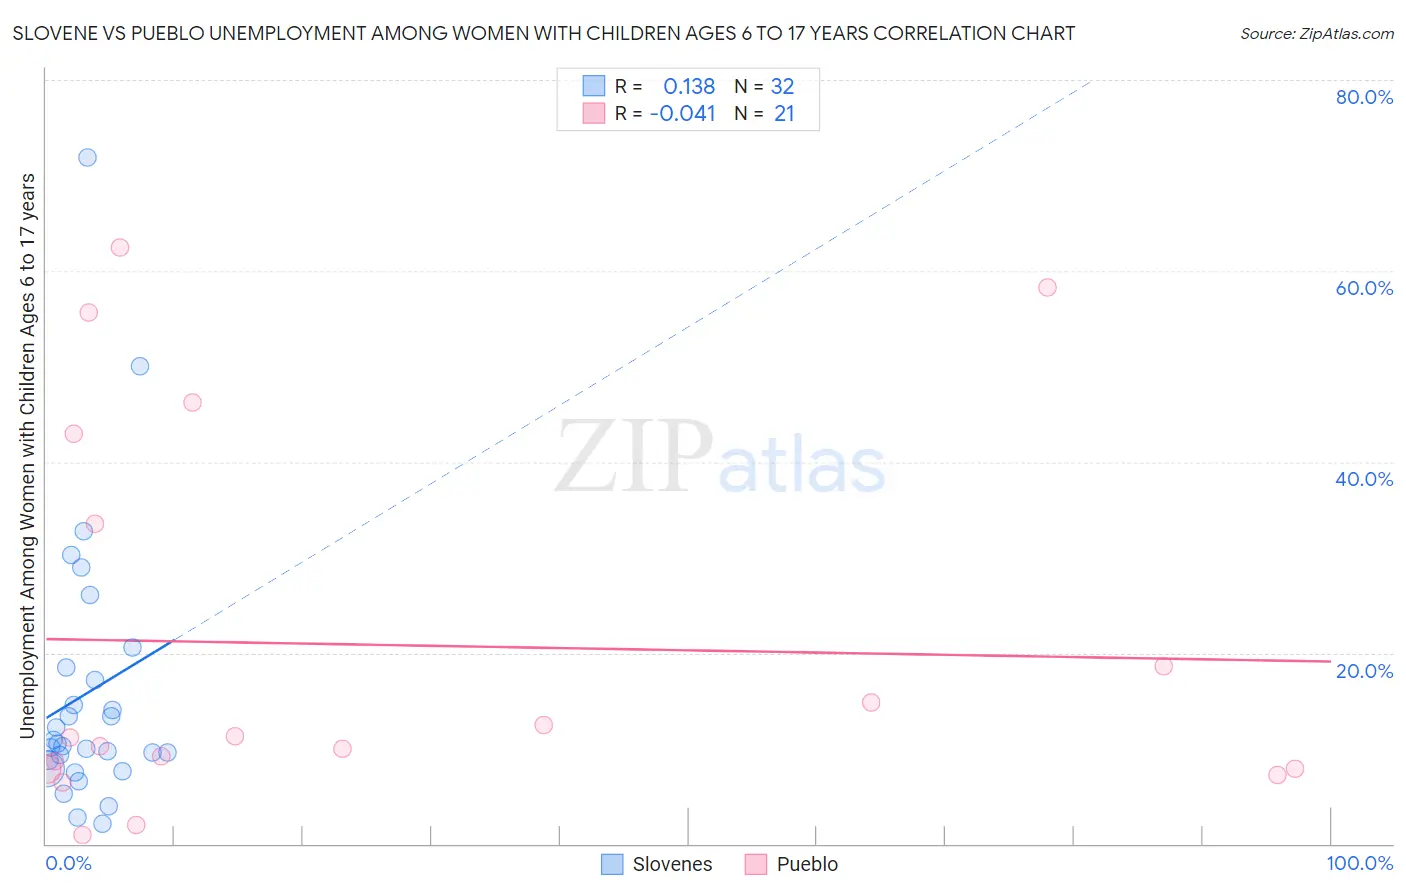
Slovene vs Pueblo Unemployment Among Women with Children Ages 6 to 17 years Correlation Chart
The statistical analysis conducted on geographies consisting of 193,849,840 people shows a poor positive correlation between the proportion of Slovenes and unemployment rate among women with children between the ages 6 and 17 in the United States with a correlation coefficient (R) of 0.138 and weighted average of 9.1%. Similarly, the statistical analysis conducted on geographies consisting of 103,975,962 people shows no correlation between the proportion of Pueblo and unemployment rate among women with children between the ages 6 and 17 in the United States with a correlation coefficient (R) of -0.041 and weighted average of 8.6%, a difference of 4.8%.
Unemployment Among Women with Children Ages 6 to 17 years Correlation Summary
| Measurement | Slovene | Pueblo |
| Minimum | 2.1% | 0.90% |
| Maximum | 71.9% | 62.5% |
| Range | 69.8% | 61.6% |
| Mean | 15.8% | 20.8% |
| Median | 10.4% | 11.1% |
| Interquartile 25% (IQ1) | 8.3% | 7.8% |
| Interquartile 75% (IQ3) | 17.8% | 38.2% |
| Interquartile Range (IQR) | 9.5% | 30.4% |
| Standard Deviation (Sample) | 14.4% | 19.9% |
| Standard Deviation (Population) | 14.2% | 19.4% |
Similar Demographics by Unemployment Among Women with Children Ages 6 to 17 years
Demographics Similar to Slovenes by Unemployment Among Women with Children Ages 6 to 17 years
In terms of unemployment among women with children ages 6 to 17 years, the demographic groups most similar to Slovenes are Belizean (9.1%, a difference of 0.0%), Immigrants (9.1%, a difference of 0.040%), Immigrants from Syria (9.1%, a difference of 0.070%), Guamanian/Chamorro (9.1%, a difference of 0.070%), and Comanche (9.0%, a difference of 0.080%).
| Demographics | Rating | Rank | Unemployment Among Women with Children Ages 6 to 17 years |
| Swiss | 33.5 /100 | #183 | Fair 9.0% |
| Palestinians | 33.4 /100 | #184 | Fair 9.0% |
| Immigrants | Congo | 32.5 /100 | #185 | Fair 9.0% |
| Immigrants | Spain | 32.4 /100 | #186 | Fair 9.0% |
| Comanche | 30.0 /100 | #187 | Fair 9.0% |
| Immigrants | Syria | 29.7 /100 | #188 | Fair 9.1% |
| Immigrants | Immigrants | 29.2 /100 | #189 | Fair 9.1% |
| Slovenes | 28.5 /100 | #190 | Fair 9.1% |
| Belizeans | 28.4 /100 | #191 | Fair 9.1% |
| Guamanians/Chamorros | 27.2 /100 | #192 | Fair 9.1% |
| Immigrants | Turkey | 25.8 /100 | #193 | Fair 9.1% |
| Immigrants | Kazakhstan | 25.3 /100 | #194 | Fair 9.1% |
| Austrians | 25.0 /100 | #195 | Fair 9.1% |
| Brazilians | 24.4 /100 | #196 | Fair 9.1% |
| Immigrants | Panama | 24.3 /100 | #197 | Fair 9.1% |
Demographics Similar to Pueblo by Unemployment Among Women with Children Ages 6 to 17 years
In terms of unemployment among women with children ages 6 to 17 years, the demographic groups most similar to Pueblo are Immigrants from Grenada (8.6%, a difference of 0.010%), Albanian (8.6%, a difference of 0.030%), Zimbabwean (8.6%, a difference of 0.040%), Israeli (8.7%, a difference of 0.090%), and Argentinean (8.6%, a difference of 0.11%).
| Demographics | Rating | Rank | Unemployment Among Women with Children Ages 6 to 17 years |
| Immigrants | Ukraine | 97.4 /100 | #111 | Exceptional 8.6% |
| Romanians | 97.1 /100 | #112 | Exceptional 8.6% |
| Eastern Europeans | 96.8 /100 | #113 | Exceptional 8.6% |
| Immigrants | Russia | 96.7 /100 | #114 | Exceptional 8.6% |
| Argentineans | 96.5 /100 | #115 | Exceptional 8.6% |
| Zimbabweans | 96.3 /100 | #116 | Exceptional 8.6% |
| Albanians | 96.3 /100 | #117 | Exceptional 8.6% |
| Pueblo | 96.2 /100 | #118 | Exceptional 8.6% |
| Immigrants | Grenada | 96.2 /100 | #119 | Exceptional 8.6% |
| Israelis | 95.9 /100 | #120 | Exceptional 8.7% |
| Immigrants | Denmark | 95.5 /100 | #121 | Exceptional 8.7% |
| Immigrants | Egypt | 95.0 /100 | #122 | Exceptional 8.7% |
| Immigrants | Morocco | 94.9 /100 | #123 | Exceptional 8.7% |
| Immigrants | Lebanon | 94.9 /100 | #124 | Exceptional 8.7% |
| South Africans | 94.6 /100 | #125 | Exceptional 8.7% |