Slovene vs Palestinian Unemployment Among Women with Children Under 18 years
COMPARE
Slovene
Palestinian
Unemployment Among Women with Children Under 18 years
Unemployment Among Women with Children Under 18 years Comparison
Slovenes
Palestinians
4.9%
UNEMPLOYMENT AMONG WOMEN WITH CHILDREN UNDER 18 YEARS
99.8/ 100
METRIC RATING
18th/ 347
METRIC RANK
5.2%
UNEMPLOYMENT AMONG WOMEN WITH CHILDREN UNDER 18 YEARS
92.2/ 100
METRIC RATING
97th/ 347
METRIC RANK
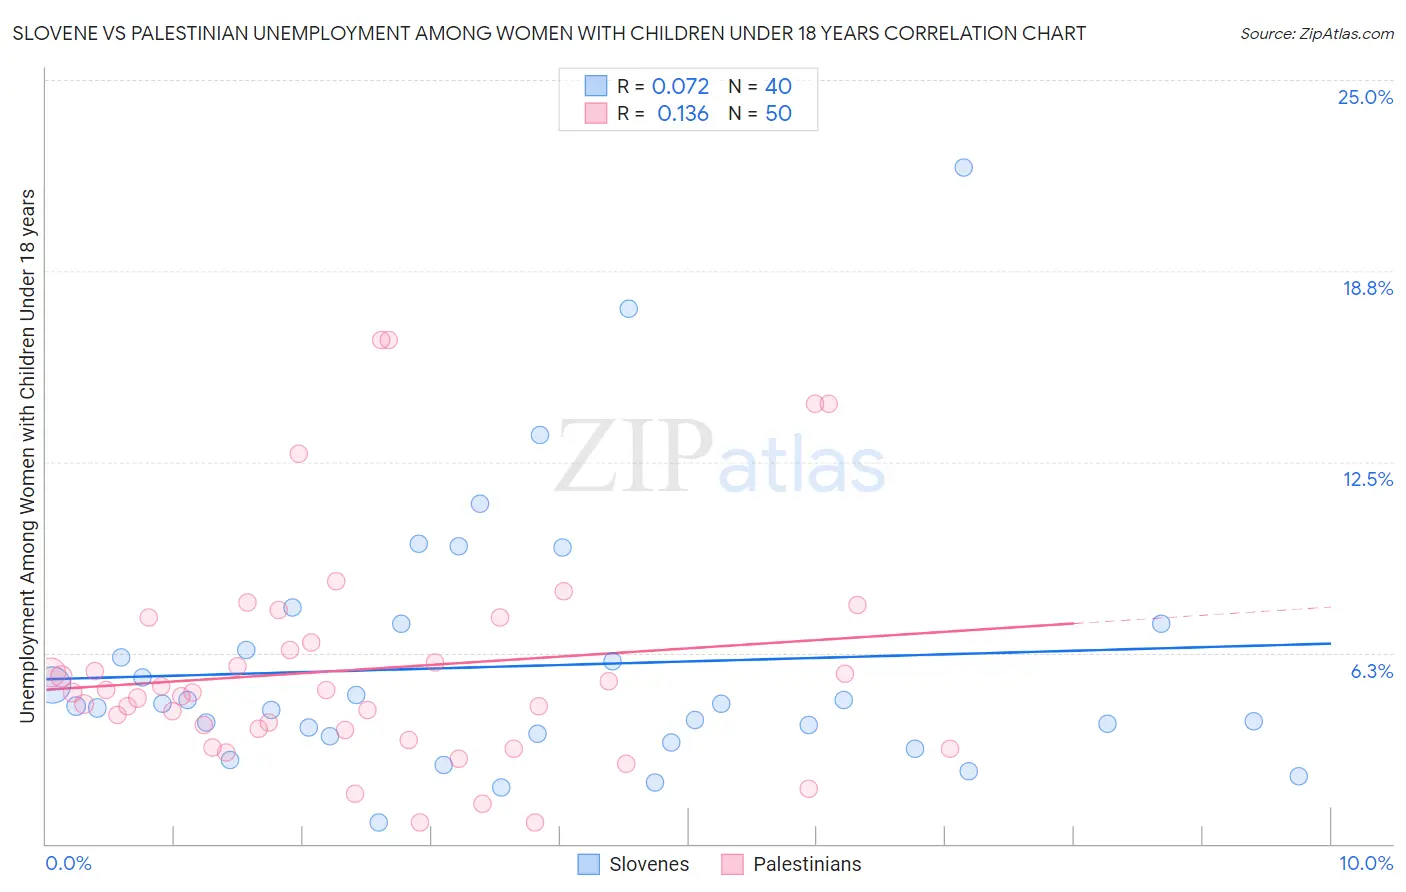
Slovene vs Palestinian Unemployment Among Women with Children Under 18 years Correlation Chart
The statistical analysis conducted on geographies consisting of 251,518,758 people shows a slight positive correlation between the proportion of Slovenes and unemployment rate among women with children under the age of 18 in the United States with a correlation coefficient (R) of 0.072 and weighted average of 4.9%. Similarly, the statistical analysis conducted on geographies consisting of 212,856,912 people shows a poor positive correlation between the proportion of Palestinians and unemployment rate among women with children under the age of 18 in the United States with a correlation coefficient (R) of 0.136 and weighted average of 5.2%, a difference of 7.2%.
Unemployment Among Women with Children Under 18 years Correlation Summary
| Measurement | Slovene | Palestinian |
| Minimum | 0.71% | 0.70% |
| Maximum | 22.1% | 16.5% |
| Range | 21.4% | 15.8% |
| Mean | 5.8% | 5.7% |
| Median | 4.5% | 4.9% |
| Interquartile 25% (IQ1) | 3.5% | 3.7% |
| Interquartile 75% (IQ3) | 6.8% | 6.6% |
| Interquartile Range (IQR) | 3.2% | 2.9% |
| Standard Deviation (Sample) | 4.2% | 3.6% |
| Standard Deviation (Population) | 4.2% | 3.6% |
Similar Demographics by Unemployment Among Women with Children Under 18 years
Demographics Similar to Slovenes by Unemployment Among Women with Children Under 18 years
In terms of unemployment among women with children under 18 years, the demographic groups most similar to Slovenes are Immigrants from Singapore (4.9%, a difference of 0.11%), German (4.9%, a difference of 0.16%), Latvian (4.9%, a difference of 0.28%), Taiwanese (4.8%, a difference of 0.31%), and Thai (4.8%, a difference of 0.77%).
| Demographics | Rating | Rank | Unemployment Among Women with Children Under 18 years |
| Filipinos | 99.9 /100 | #11 | Exceptional 4.8% |
| Scandinavians | 99.9 /100 | #12 | Exceptional 4.8% |
| Bulgarians | 99.9 /100 | #13 | Exceptional 4.8% |
| Cambodians | 99.9 /100 | #14 | Exceptional 4.8% |
| Thais | 99.8 /100 | #15 | Exceptional 4.8% |
| Taiwanese | 99.8 /100 | #16 | Exceptional 4.8% |
| Immigrants | Singapore | 99.8 /100 | #17 | Exceptional 4.9% |
| Slovenes | 99.8 /100 | #18 | Exceptional 4.9% |
| Germans | 99.8 /100 | #19 | Exceptional 4.9% |
| Latvians | 99.7 /100 | #20 | Exceptional 4.9% |
| Europeans | 99.6 /100 | #21 | Exceptional 4.9% |
| Indians (Asian) | 99.6 /100 | #22 | Exceptional 4.9% |
| Immigrants | China | 99.6 /100 | #23 | Exceptional 4.9% |
| Belgians | 99.5 /100 | #24 | Exceptional 4.9% |
| Chinese | 99.5 /100 | #25 | Exceptional 4.9% |
Demographics Similar to Palestinians by Unemployment Among Women with Children Under 18 years
In terms of unemployment among women with children under 18 years, the demographic groups most similar to Palestinians are Immigrants from Albania (5.2%, a difference of 0.0%), Immigrants from North America (5.2%, a difference of 0.020%), Immigrants from Vietnam (5.2%, a difference of 0.040%), Cuban (5.2%, a difference of 0.10%), and Immigrants from Kuwait (5.2%, a difference of 0.11%).
| Demographics | Rating | Rank | Unemployment Among Women with Children Under 18 years |
| Ukrainians | 93.8 /100 | #90 | Exceptional 5.2% |
| Immigrants | Zimbabwe | 93.6 /100 | #91 | Exceptional 5.2% |
| Immigrants | Pakistan | 93.3 /100 | #92 | Exceptional 5.2% |
| Immigrants | Canada | 93.3 /100 | #93 | Exceptional 5.2% |
| Immigrants | Kuwait | 92.6 /100 | #94 | Exceptional 5.2% |
| Immigrants | North America | 92.3 /100 | #95 | Exceptional 5.2% |
| Immigrants | Albania | 92.2 /100 | #96 | Exceptional 5.2% |
| Palestinians | 92.2 /100 | #97 | Exceptional 5.2% |
| Immigrants | Vietnam | 92.0 /100 | #98 | Exceptional 5.2% |
| Cubans | 91.8 /100 | #99 | Exceptional 5.2% |
| Immigrants | Greece | 91.4 /100 | #100 | Exceptional 5.2% |
| Immigrants | Netherlands | 91.0 /100 | #101 | Exceptional 5.2% |
| Immigrants | Cuba | 90.9 /100 | #102 | Exceptional 5.2% |
| Sri Lankans | 90.3 /100 | #103 | Exceptional 5.2% |
| Immigrants | Switzerland | 90.1 /100 | #104 | Exceptional 5.2% |