Slovene vs Immigrants from Armenia Unemployment Among Seniors over 75 years
COMPARE
Slovene
Immigrants from Armenia
Unemployment Among Seniors over 75 years
Unemployment Among Seniors over 75 years Comparison
Slovenes
Immigrants from Armenia
9.3%
UNEMPLOYMENT AMONG SENIORS OVER 75 YEARS
1.0/ 100
METRIC RATING
259th/ 347
METRIC RANK
6.5%
UNEMPLOYMENT AMONG SENIORS OVER 75 YEARS
100.0/ 100
METRIC RATING
6th/ 347
METRIC RANK
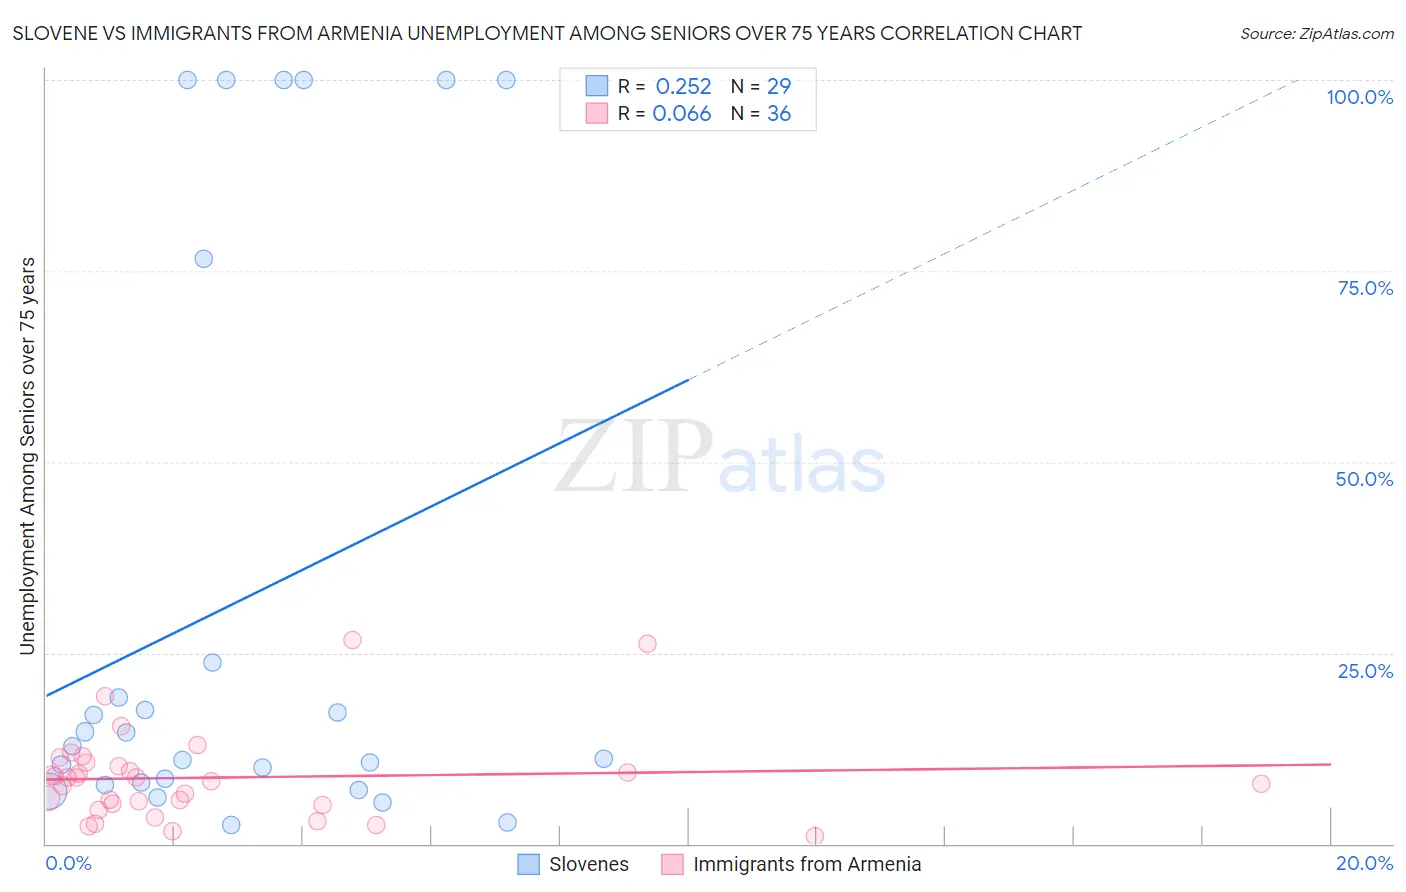
Slovene vs Immigrants from Armenia Unemployment Among Seniors over 75 years Correlation Chart
The statistical analysis conducted on geographies consisting of 150,124,678 people shows a weak positive correlation between the proportion of Slovenes and unemployment rate among seniors over the age of 75 in the United States with a correlation coefficient (R) of 0.252 and weighted average of 9.3%. Similarly, the statistical analysis conducted on geographies consisting of 75,716,267 people shows a slight positive correlation between the proportion of Immigrants from Armenia and unemployment rate among seniors over the age of 75 in the United States with a correlation coefficient (R) of 0.066 and weighted average of 6.5%, a difference of 42.5%.
Unemployment Among Seniors over 75 years Correlation Summary
| Measurement | Slovene | Immigrants from Armenia |
| Minimum | 2.5% | 1.0% |
| Maximum | 100.0% | 26.6% |
| Range | 97.5% | 25.6% |
| Mean | 31.8% | 8.7% |
| Median | 12.7% | 8.4% |
| Interquartile 25% (IQ1) | 7.9% | 5.2% |
| Interquartile 75% (IQ3) | 50.2% | 10.5% |
| Interquartile Range (IQR) | 42.3% | 5.3% |
| Standard Deviation (Sample) | 37.8% | 5.9% |
| Standard Deviation (Population) | 37.1% | 5.8% |
Similar Demographics by Unemployment Among Seniors over 75 years
Demographics Similar to Slovenes by Unemployment Among Seniors over 75 years
In terms of unemployment among seniors over 75 years, the demographic groups most similar to Slovenes are Immigrants from England (9.3%, a difference of 0.010%), Immigrants from Cameroon (9.3%, a difference of 0.050%), Hawaiian (9.3%, a difference of 0.16%), Brazilian (9.3%, a difference of 0.28%), and Celtic (9.3%, a difference of 0.31%).
| Demographics | Rating | Rank | Unemployment Among Seniors over 75 years |
| Immigrants | Sudan | 2.0 /100 | #252 | Tragic 9.2% |
| Pima | 1.8 /100 | #253 | Tragic 9.2% |
| Immigrants | Ghana | 1.7 /100 | #254 | Tragic 9.2% |
| Immigrants | Scotland | 1.4 /100 | #255 | Tragic 9.2% |
| Brazilians | 1.3 /100 | #256 | Tragic 9.3% |
| Hawaiians | 1.2 /100 | #257 | Tragic 9.3% |
| Immigrants | England | 1.0 /100 | #258 | Tragic 9.3% |
| Slovenes | 1.0 /100 | #259 | Tragic 9.3% |
| Immigrants | Cameroon | 1.0 /100 | #260 | Tragic 9.3% |
| Celtics | 0.8 /100 | #261 | Tragic 9.3% |
| Austrians | 0.7 /100 | #262 | Tragic 9.3% |
| Ukrainians | 0.7 /100 | #263 | Tragic 9.3% |
| Iroquois | 0.7 /100 | #264 | Tragic 9.3% |
| Palestinians | 0.6 /100 | #265 | Tragic 9.3% |
| Blacks/African Americans | 0.5 /100 | #266 | Tragic 9.4% |
Demographics Similar to Immigrants from Armenia by Unemployment Among Seniors over 75 years
In terms of unemployment among seniors over 75 years, the demographic groups most similar to Immigrants from Armenia are Spanish American Indian (6.5%, a difference of 0.39%), Taiwanese (6.6%, a difference of 0.79%), Soviet Union (6.6%, a difference of 2.1%), Yuman (6.7%, a difference of 2.3%), and Immigrants from Grenada (6.7%, a difference of 2.4%).
| Demographics | Rating | Rank | Unemployment Among Seniors over 75 years |
| Crow | 100.0 /100 | #1 | Exceptional 5.9% |
| Chinese | 100.0 /100 | #2 | Exceptional 5.9% |
| Cheyenne | 100.0 /100 | #3 | Exceptional 5.9% |
| Alsatians | 100.0 /100 | #4 | Exceptional 6.1% |
| Hopi | 100.0 /100 | #5 | Exceptional 6.3% |
| Immigrants | Armenia | 100.0 /100 | #6 | Exceptional 6.5% |
| Spanish American Indians | 100.0 /100 | #7 | Exceptional 6.5% |
| Taiwanese | 100.0 /100 | #8 | Exceptional 6.6% |
| Soviet Union | 100.0 /100 | #9 | Exceptional 6.6% |
| Yuman | 100.0 /100 | #10 | Exceptional 6.7% |
| Immigrants | Grenada | 100.0 /100 | #11 | Exceptional 6.7% |
| Comanche | 100.0 /100 | #12 | Exceptional 6.7% |
| Immigrants | Congo | 100.0 /100 | #13 | Exceptional 6.7% |
| Ute | 100.0 /100 | #14 | Exceptional 6.8% |
| Icelanders | 100.0 /100 | #15 | Exceptional 7.0% |