Slovak vs Immigrants from Nepal Male Unemployment
COMPARE
Slovak
Immigrants from Nepal
Male Unemployment
Male Unemployment Comparison
Slovaks
Immigrants from Nepal
5.2%
MALE UNEMPLOYMENT
75.5/ 100
METRIC RATING
151st/ 347
METRIC RANK
4.8%
MALE UNEMPLOYMENT
99.8/ 100
METRIC RATING
32nd/ 347
METRIC RANK
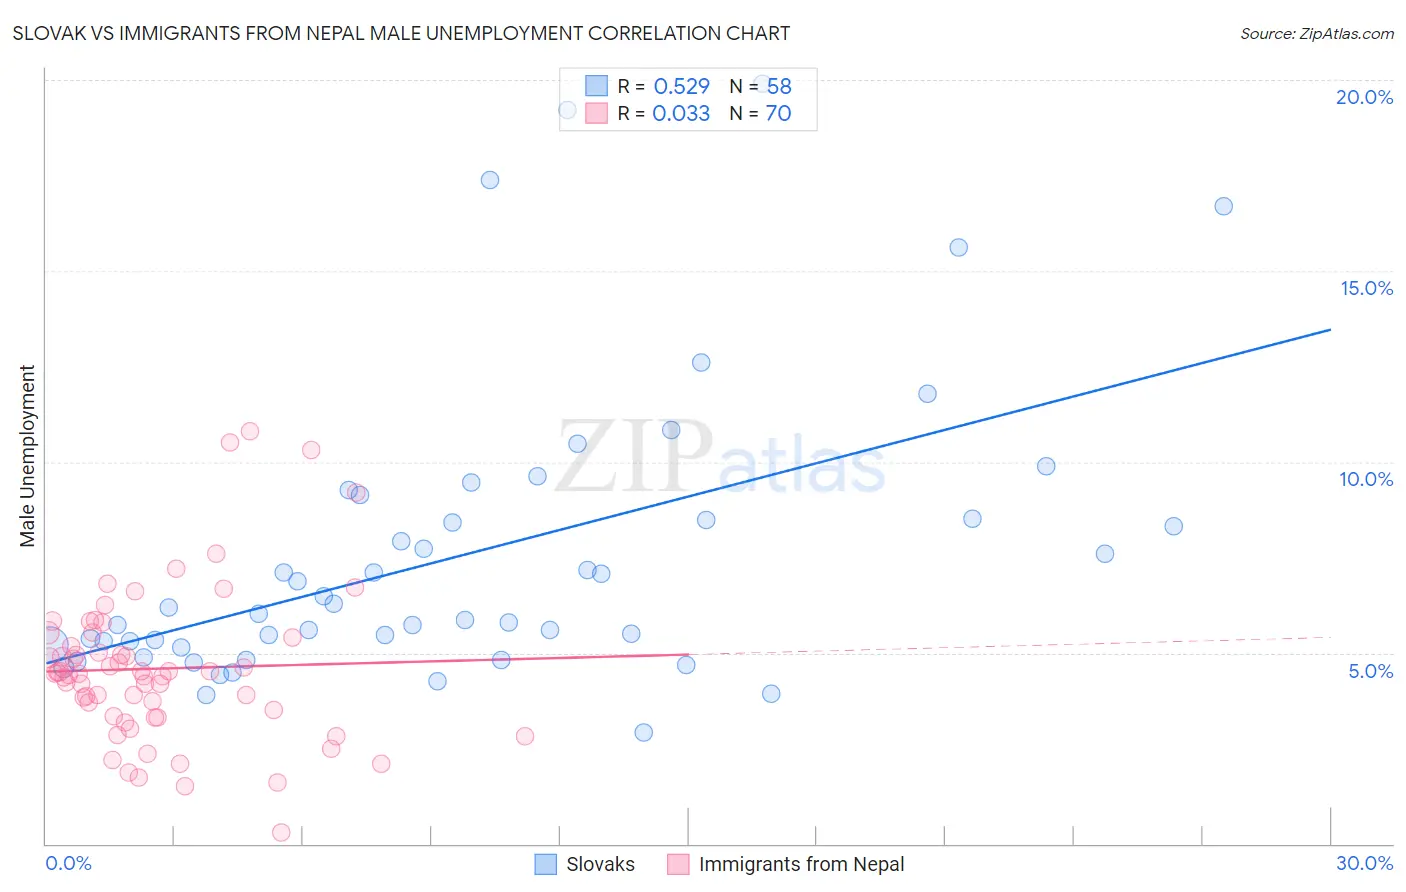
Slovak vs Immigrants from Nepal Male Unemployment Correlation Chart
The statistical analysis conducted on geographies consisting of 395,477,996 people shows a substantial positive correlation between the proportion of Slovaks and unemployment rate among males in the United States with a correlation coefficient (R) of 0.529 and weighted average of 5.2%. Similarly, the statistical analysis conducted on geographies consisting of 186,501,953 people shows no correlation between the proportion of Immigrants from Nepal and unemployment rate among males in the United States with a correlation coefficient (R) of 0.033 and weighted average of 4.8%, a difference of 7.8%.
Male Unemployment Correlation Summary
| Measurement | Slovak | Immigrants from Nepal |
| Minimum | 2.9% | 0.30% |
| Maximum | 19.9% | 10.8% |
| Range | 17.0% | 10.5% |
| Mean | 7.6% | 4.6% |
| Median | 6.1% | 4.5% |
| Interquartile 25% (IQ1) | 5.2% | 3.4% |
| Interquartile 75% (IQ3) | 8.5% | 5.4% |
| Interquartile Range (IQR) | 3.3% | 2.0% |
| Standard Deviation (Sample) | 3.8% | 2.0% |
| Standard Deviation (Population) | 3.8% | 2.0% |
Similar Demographics by Male Unemployment
Demographics Similar to Slovaks by Male Unemployment
In terms of male unemployment, the demographic groups most similar to Slovaks are Indian (Asian) (5.2%, a difference of 0.040%), Egyptian (5.2%, a difference of 0.050%), Immigrants from Italy (5.2%, a difference of 0.060%), Immigrants from Europe (5.2%, a difference of 0.060%), and Immigrants from Uruguay (5.2%, a difference of 0.13%).
| Demographics | Rating | Rank | Male Unemployment |
| Sri Lankans | 77.9 /100 | #144 | Good 5.2% |
| Macedonians | 77.7 /100 | #145 | Good 5.2% |
| Immigrants | Kenya | 77.6 /100 | #146 | Good 5.2% |
| Immigrants | Burma/Myanmar | 77.5 /100 | #147 | Good 5.2% |
| Immigrants | Italy | 76.3 /100 | #148 | Good 5.2% |
| Immigrants | Europe | 76.2 /100 | #149 | Good 5.2% |
| Indians (Asian) | 76.0 /100 | #150 | Good 5.2% |
| Slovaks | 75.5 /100 | #151 | Good 5.2% |
| Egyptians | 74.8 /100 | #152 | Good 5.2% |
| Immigrants | Uruguay | 73.9 /100 | #153 | Good 5.2% |
| Laotians | 73.8 /100 | #154 | Good 5.2% |
| Immigrants | Hungary | 73.4 /100 | #155 | Good 5.2% |
| Americans | 72.7 /100 | #156 | Good 5.2% |
| Immigrants | Northern Africa | 72.3 /100 | #157 | Good 5.2% |
| Immigrants | Indonesia | 71.5 /100 | #158 | Good 5.2% |
Demographics Similar to Immigrants from Nepal by Male Unemployment
In terms of male unemployment, the demographic groups most similar to Immigrants from Nepal are Sudanese (4.8%, a difference of 0.010%), British (4.8%, a difference of 0.26%), Latvian (4.8%, a difference of 0.30%), Welsh (4.8%, a difference of 0.38%), and Scottish (4.8%, a difference of 0.57%).
| Demographics | Rating | Rank | Male Unemployment |
| Zimbabweans | 99.9 /100 | #25 | Exceptional 4.8% |
| Dutch | 99.9 /100 | #26 | Exceptional 4.8% |
| Belgians | 99.9 /100 | #27 | Exceptional 4.8% |
| Bulgarians | 99.8 /100 | #28 | Exceptional 4.8% |
| Scottish | 99.8 /100 | #29 | Exceptional 4.8% |
| British | 99.8 /100 | #30 | Exceptional 4.8% |
| Sudanese | 99.8 /100 | #31 | Exceptional 4.8% |
| Immigrants | Nepal | 99.8 /100 | #32 | Exceptional 4.8% |
| Latvians | 99.7 /100 | #33 | Exceptional 4.8% |
| Welsh | 99.7 /100 | #34 | Exceptional 4.8% |
| Paraguayans | 99.5 /100 | #35 | Exceptional 4.9% |
| Immigrants | Singapore | 99.4 /100 | #36 | Exceptional 4.9% |
| Scotch-Irish | 99.4 /100 | #37 | Exceptional 4.9% |
| Immigrants | Bosnia and Herzegovina | 99.4 /100 | #38 | Exceptional 4.9% |
| Burmese | 99.3 /100 | #39 | Exceptional 4.9% |