Slovak vs Immigrants from Ghana Unemployment Among Ages 20 to 24 years
COMPARE
Slovak
Immigrants from Ghana
Unemployment Among Ages 20 to 24 years
Unemployment Among Ages 20 to 24 years Comparison
Slovaks
Immigrants from Ghana
10.2%
UNEMPLOYMENT AMONG AGES 20 TO 24 YEARS
80.2/ 100
METRIC RATING
142nd/ 347
METRIC RANK
11.9%
UNEMPLOYMENT AMONG AGES 20 TO 24 YEARS
0.0/ 100
METRIC RATING
293rd/ 347
METRIC RANK
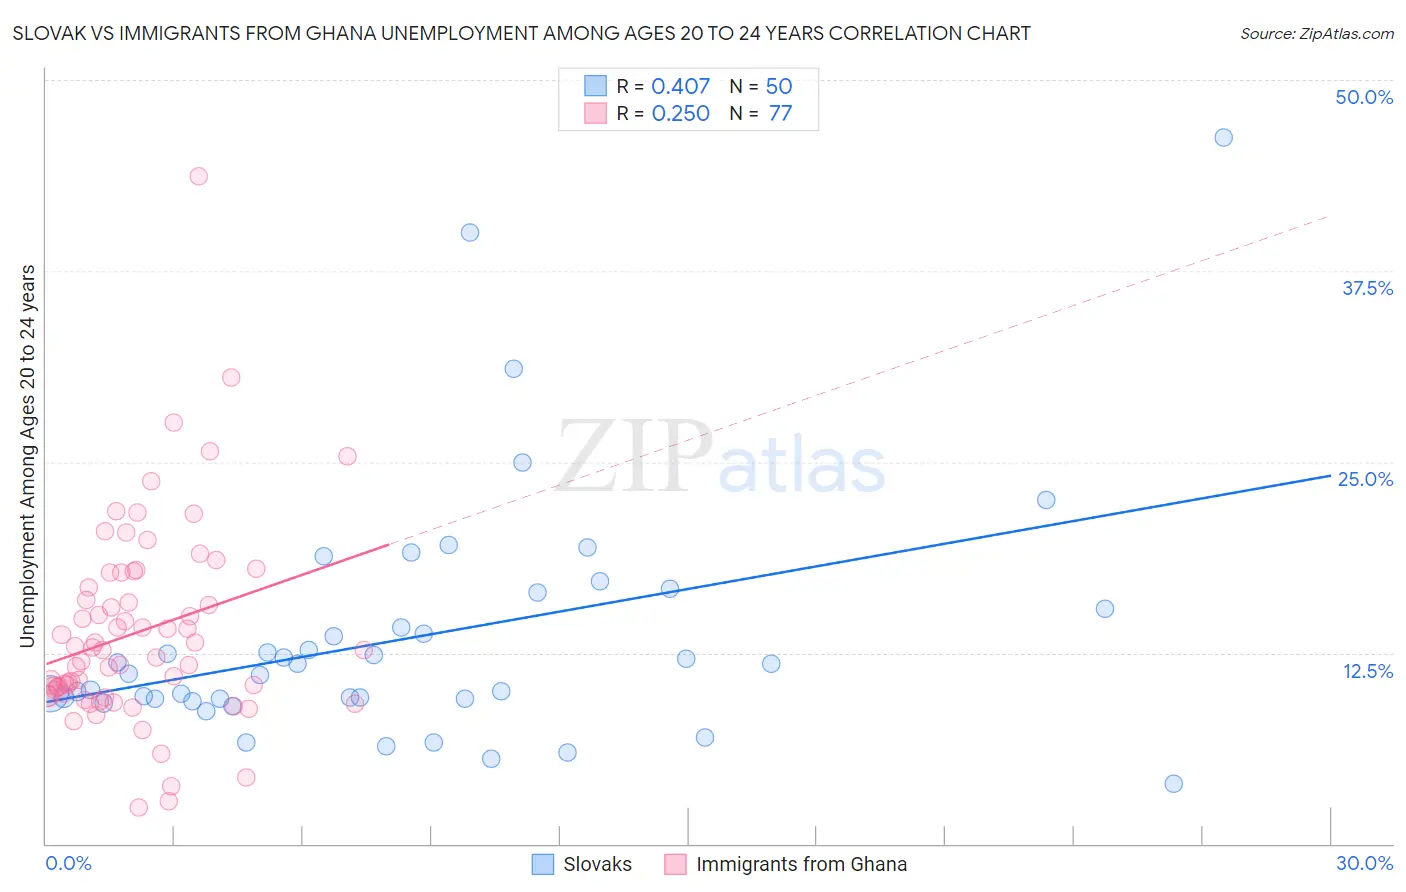
Slovak vs Immigrants from Ghana Unemployment Among Ages 20 to 24 years Correlation Chart
The statistical analysis conducted on geographies consisting of 381,138,235 people shows a moderate positive correlation between the proportion of Slovaks and unemployment rate among population between the ages 20 and 24 in the United States with a correlation coefficient (R) of 0.407 and weighted average of 10.2%. Similarly, the statistical analysis conducted on geographies consisting of 197,571,933 people shows a weak positive correlation between the proportion of Immigrants from Ghana and unemployment rate among population between the ages 20 and 24 in the United States with a correlation coefficient (R) of 0.250 and weighted average of 11.9%, a difference of 17.4%.
Unemployment Among Ages 20 to 24 years Correlation Summary
| Measurement | Slovak | Immigrants from Ghana |
| Minimum | 3.9% | 2.4% |
| Maximum | 46.2% | 43.7% |
| Range | 42.3% | 41.3% |
| Mean | 13.5% | 13.9% |
| Median | 11.5% | 12.7% |
| Interquartile 25% (IQ1) | 9.5% | 9.7% |
| Interquartile 75% (IQ3) | 15.4% | 17.3% |
| Interquartile Range (IQR) | 5.9% | 7.5% |
| Standard Deviation (Sample) | 8.0% | 6.5% |
| Standard Deviation (Population) | 7.9% | 6.5% |
Similar Demographics by Unemployment Among Ages 20 to 24 years
Demographics Similar to Slovaks by Unemployment Among Ages 20 to 24 years
In terms of unemployment among ages 20 to 24 years, the demographic groups most similar to Slovaks are Immigrants from Austria (10.2%, a difference of 0.070%), Immigrants from the Azores (10.2%, a difference of 0.070%), Immigrants from Jordan (10.2%, a difference of 0.070%), Uruguayan (10.2%, a difference of 0.10%), and Brazilian (10.2%, a difference of 0.11%).
| Demographics | Rating | Rank | Unemployment Among Ages 20 to 24 years |
| Comanche | 83.4 /100 | #135 | Excellent 10.2% |
| Immigrants | Northern Africa | 82.5 /100 | #136 | Excellent 10.2% |
| Immigrants | North America | 82.5 /100 | #137 | Excellent 10.2% |
| Burmese | 82.3 /100 | #138 | Excellent 10.2% |
| Uruguayans | 81.9 /100 | #139 | Excellent 10.2% |
| Immigrants | Austria | 81.4 /100 | #140 | Excellent 10.2% |
| Immigrants | Azores | 81.4 /100 | #141 | Excellent 10.2% |
| Slovaks | 80.2 /100 | #142 | Excellent 10.2% |
| Immigrants | Jordan | 79.0 /100 | #143 | Good 10.2% |
| Brazilians | 78.4 /100 | #144 | Good 10.2% |
| Argentineans | 78.0 /100 | #145 | Good 10.2% |
| Asians | 77.7 /100 | #146 | Good 10.2% |
| French Canadians | 77.5 /100 | #147 | Good 10.2% |
| Immigrants | Romania | 75.7 /100 | #148 | Good 10.2% |
| Immigrants | Scotland | 74.6 /100 | #149 | Good 10.2% |
Demographics Similar to Immigrants from Ghana by Unemployment Among Ages 20 to 24 years
In terms of unemployment among ages 20 to 24 years, the demographic groups most similar to Immigrants from Ghana are Immigrants from Belize (12.0%, a difference of 0.030%), Immigrants from Armenia (12.0%, a difference of 0.21%), Immigrants from Senegal (11.9%, a difference of 0.23%), Cajun (12.0%, a difference of 0.24%), and Blackfeet (12.0%, a difference of 0.25%).
| Demographics | Rating | Rank | Unemployment Among Ages 20 to 24 years |
| Ecuadorians | 0.0 /100 | #286 | Tragic 11.8% |
| Immigrants | Ecuador | 0.0 /100 | #287 | Tragic 11.8% |
| U.S. Virgin Islanders | 0.0 /100 | #288 | Tragic 11.8% |
| Belizeans | 0.0 /100 | #289 | Tragic 11.8% |
| Immigrants | Caribbean | 0.0 /100 | #290 | Tragic 11.8% |
| Central American Indians | 0.0 /100 | #291 | Tragic 11.9% |
| Immigrants | Senegal | 0.0 /100 | #292 | Tragic 11.9% |
| Immigrants | Ghana | 0.0 /100 | #293 | Tragic 11.9% |
| Immigrants | Belize | 0.0 /100 | #294 | Tragic 12.0% |
| Immigrants | Armenia | 0.0 /100 | #295 | Tragic 12.0% |
| Cajuns | 0.0 /100 | #296 | Tragic 12.0% |
| Blackfeet | 0.0 /100 | #297 | Tragic 12.0% |
| Lumbee | 0.0 /100 | #298 | Tragic 12.0% |
| Apache | 0.0 /100 | #299 | Tragic 12.0% |
| Spanish American Indians | 0.0 /100 | #300 | Tragic 12.1% |