Slovak vs Cape Verdean Unemployment Among Ages 30 to 34 years
COMPARE
Slovak
Cape Verdean
Unemployment Among Ages 30 to 34 years
Unemployment Among Ages 30 to 34 years Comparison
Slovaks
Cape Verdeans
5.8%
UNEMPLOYMENT AMONG AGES 30 TO 34 YEARS
2.5/ 100
METRIC RATING
224th/ 347
METRIC RANK
7.2%
UNEMPLOYMENT AMONG AGES 30 TO 34 YEARS
0.0/ 100
METRIC RATING
320th/ 347
METRIC RANK
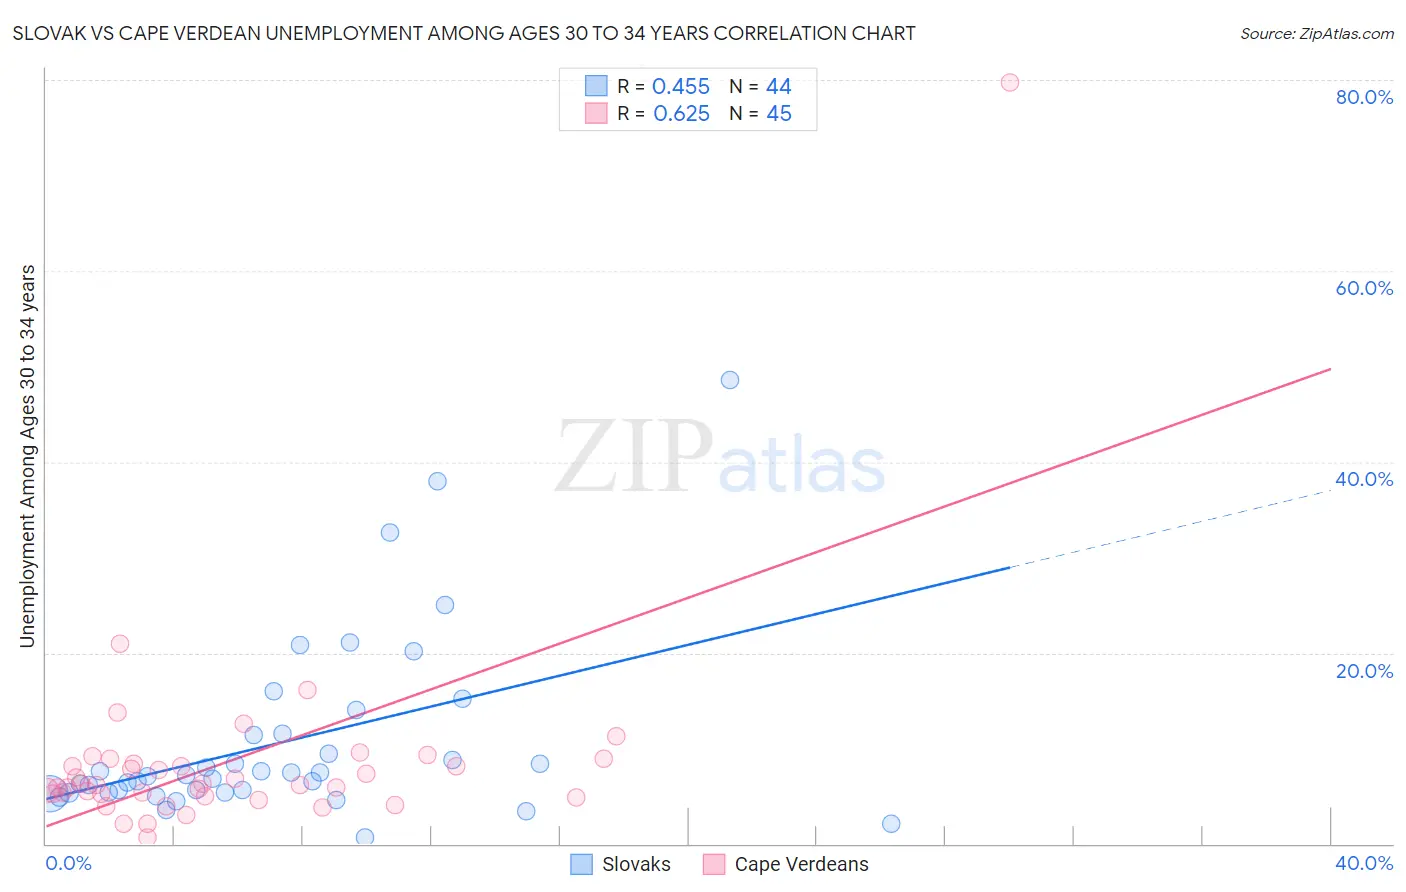
Slovak vs Cape Verdean Unemployment Among Ages 30 to 34 years Correlation Chart
The statistical analysis conducted on geographies consisting of 367,753,529 people shows a moderate positive correlation between the proportion of Slovaks and unemployment rate among population between the ages 30 and 34 in the United States with a correlation coefficient (R) of 0.455 and weighted average of 5.8%. Similarly, the statistical analysis conducted on geographies consisting of 105,621,917 people shows a significant positive correlation between the proportion of Cape Verdeans and unemployment rate among population between the ages 30 and 34 in the United States with a correlation coefficient (R) of 0.625 and weighted average of 7.2%, a difference of 23.7%.
Unemployment Among Ages 30 to 34 years Correlation Summary
| Measurement | Slovak | Cape Verdean |
| Minimum | 0.70% | 0.60% |
| Maximum | 48.6% | 79.7% |
| Range | 47.9% | 79.1% |
| Mean | 10.6% | 8.6% |
| Median | 7.1% | 6.2% |
| Interquartile 25% (IQ1) | 5.4% | 5.1% |
| Interquartile 75% (IQ3) | 11.5% | 8.7% |
| Interquartile Range (IQR) | 6.1% | 3.6% |
| Standard Deviation (Sample) | 9.7% | 11.4% |
| Standard Deviation (Population) | 9.6% | 11.3% |
Similar Demographics by Unemployment Among Ages 30 to 34 years
Demographics Similar to Slovaks by Unemployment Among Ages 30 to 34 years
In terms of unemployment among ages 30 to 34 years, the demographic groups most similar to Slovaks are Samoan (5.8%, a difference of 0.030%), Bermudan (5.8%, a difference of 0.15%), Liberian (5.8%, a difference of 0.15%), Spaniard (5.8%, a difference of 0.41%), and Spanish (5.8%, a difference of 0.50%).
| Demographics | Rating | Rank | Unemployment Among Ages 30 to 34 years |
| Immigrants | Fiji | 5.1 /100 | #217 | Tragic 5.7% |
| Panamanians | 4.5 /100 | #218 | Tragic 5.8% |
| French Canadians | 4.4 /100 | #219 | Tragic 5.8% |
| Sierra Leoneans | 3.9 /100 | #220 | Tragic 5.8% |
| Guamanians/Chamorros | 3.9 /100 | #221 | Tragic 5.8% |
| Spaniards | 3.2 /100 | #222 | Tragic 5.8% |
| Bermudans | 2.7 /100 | #223 | Tragic 5.8% |
| Slovaks | 2.5 /100 | #224 | Tragic 5.8% |
| Samoans | 2.5 /100 | #225 | Tragic 5.8% |
| Liberians | 2.3 /100 | #226 | Tragic 5.8% |
| Spanish | 1.8 /100 | #227 | Tragic 5.8% |
| Immigrants | Bahamas | 1.8 /100 | #228 | Tragic 5.8% |
| Immigrants | Uzbekistan | 1.5 /100 | #229 | Tragic 5.9% |
| Hawaiians | 1.2 /100 | #230 | Tragic 5.9% |
| Japanese | 1.1 /100 | #231 | Tragic 5.9% |
Demographics Similar to Cape Verdeans by Unemployment Among Ages 30 to 34 years
In terms of unemployment among ages 30 to 34 years, the demographic groups most similar to Cape Verdeans are Guyanese (7.2%, a difference of 0.020%), Black/African American (7.2%, a difference of 0.090%), Immigrants from Cabo Verde (7.2%, a difference of 0.19%), Immigrants from Guyana (7.2%, a difference of 0.29%), and Houma (7.2%, a difference of 0.46%).
| Demographics | Rating | Rank | Unemployment Among Ages 30 to 34 years |
| Ute | 0.0 /100 | #313 | Tragic 7.0% |
| Lumbee | 0.0 /100 | #314 | Tragic 7.1% |
| Aleuts | 0.0 /100 | #315 | Tragic 7.1% |
| Houma | 0.0 /100 | #316 | Tragic 7.2% |
| Immigrants | Cabo Verde | 0.0 /100 | #317 | Tragic 7.2% |
| Blacks/African Americans | 0.0 /100 | #318 | Tragic 7.2% |
| Guyanese | 0.0 /100 | #319 | Tragic 7.2% |
| Cape Verdeans | 0.0 /100 | #320 | Tragic 7.2% |
| Immigrants | Guyana | 0.0 /100 | #321 | Tragic 7.2% |
| Marshallese | 0.0 /100 | #322 | Tragic 7.2% |
| Immigrants | Yemen | 0.0 /100 | #323 | Tragic 7.3% |
| Immigrants | Dominica | 0.0 /100 | #324 | Tragic 7.3% |
| Apache | 0.0 /100 | #325 | Tragic 7.3% |
| Dominicans | 0.0 /100 | #326 | Tragic 7.7% |
| Immigrants | Dominican Republic | 0.0 /100 | #327 | Tragic 7.7% |